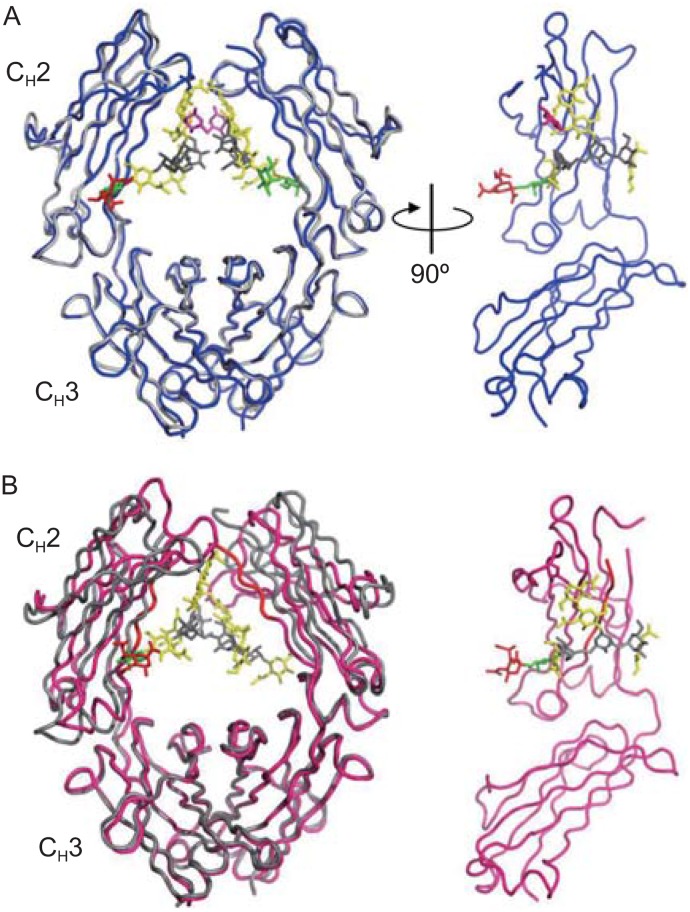
Figure 4.
Comparison of sialylated and native Fc structures. (A) Superposition of enzymatically sialylated Fc (blue) (PDB ID code: 4BYH) and native Fc (gray) (PDB ID code: 1H3Y). (B) Superposition of chemoenzymatically synthesized disialylated Fc (magenta) (PDB ID code: 4Q6Y) and native Fc (gray) (PDB ID code: 3AVE). The monosaccharides fucose, GlcNAc, mannose, galactose, and sialic acid are shown in magenta, yellow, gray, green and red, respectively. The molecular models were produced with PyMOL (The PyMOL Molecular Graphics System, Version 1.8.5.0, Schrodinger, LLC)

