Figure 1.
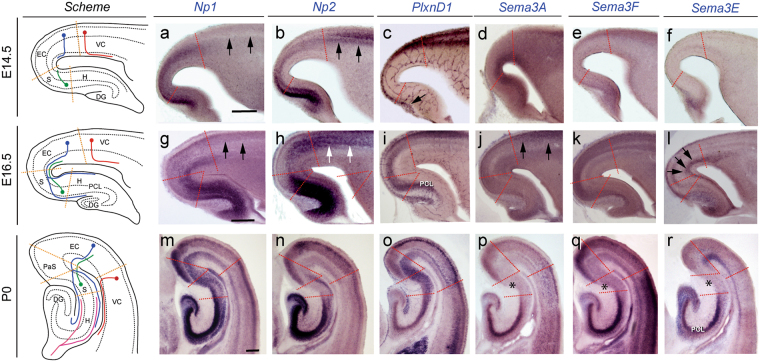
Low-power photomicrographs illustrating the distribution of Np1 (a,g,m); Np2 (b,h,n); PlnxD1 (c,i,o); Sema3A (d,j,p); Sema3F (e,k,q) and Sema3E (f,l,r) mRNA in the hippocampal formation and adjacent ventrolateral cortex at E14.5 (a–f), E16.5 (g–l) and P0 (m–r). The different regional boundaries are circumscribed by dashed lines. Characteristic corticofugal, entorhino-hippocampal, subiculo-entorhinal and commissural afferent connections are labelled in red, blue, green and pink respectively in the scheme. Note the absence of Np1 labelling in the ventrolateral cortex at E14.5 and E16.5 (arrows in a and g), compared to Np2 (arrows in b and h) and PlnxD1 (c and i). Sema3A levels in the ventrolateral neocortex were intense at E16.5 (arrows in j). In addition, Sema3E levels in lower layers of both the ventrolateral and entorhinal cortices can be seen from E16.5 onwards (arrows in l). Surprisingly, the subicular region was almost absent of semaphorin labelling (asterisk in p–r). Abbreviations: DG = dentate gyrus; EC = entorhinal cortex; H = hippocampus proper; PaS = parasubiculum; PCL = pyramidal cell layer; S = subiculum; VC = ventrolateral neocortex. Scale bars: a = 250 μm pertains to (b–f); g = 250 μm pertains to (h–l) and m = 100 μm pertains to (n–r).

