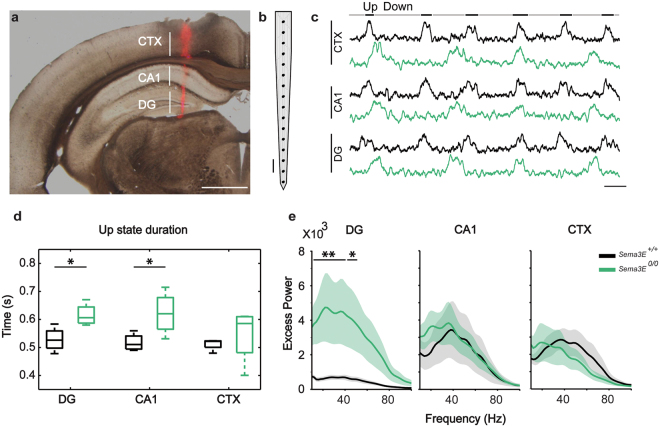
Figure 7.
Alterations in the spontaneous oscillatory activity in Sema3E0/0 mice. (a) Representative half coronal section (2.0 mm posterior to Bregma, 1.0 mm lateral from midline) showing the track of a 1 × 16 multichannel recording probe covering the cerebral cortex (CTX) and hippocampus (CA1 and DG) of a mouse. Track reconstruction was accomplished following the tissue deposition of the DiI that was applied to probe prior to insertion. (b) Schematic representation of the 16-multichannel recording probe used to record neuronal activity. (c) Representative examples showing multi-unit activity traces (200–1500 Hz) simultaneously recorded in the cerebral cortex (CTX) and hippocampus (CA1 and DG) of a Sema3E+/+ (black) and a Sema3E0/0 (green) mouse during slow oscillatory activity. No vertical scale because they are arbitrary units (see materials and Methods). (d) Up state durations recorded in the hippocampus (DG and CA1) and cerebral cortex (CTX) of Sema3E+/+ (black, n = 4) and Sema3E0/0 (green, n = 4) mice. Box plots represent the first and third quartiles with the median depicted by the horizontal line within the box and extreme values shown by whiskers. (e) Average excess power (ratio between the mean power spectral density and the fit of the 1/f decay) during local field potential Up states recorded in the hippocampus (DG and CA1) and cerebral cortex (CTX) of Sema3E+/+ (black, n = 4) and Sema3E0/0 (green, n = 4) mice. Data expressed as mean ± S.E.M (shadow). *P < 0.1, **P < 0.05, Wilcoxon rank-sum test. Scale bar: a = 1 mm; b = 100 μm; c = 0.5 s.

