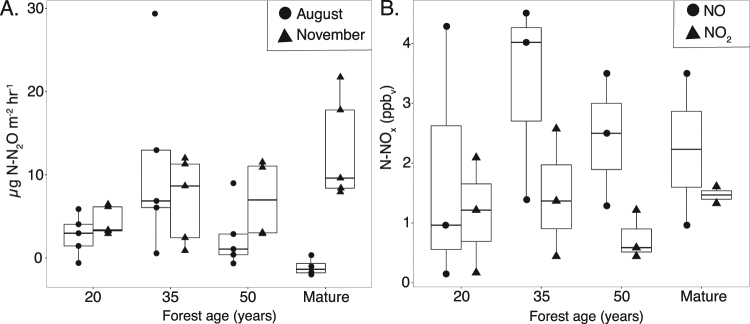
Figure 2.
Nitrogen oxide soil emissions along secondary successional forest chronosequence. (A) nitrous oxide (N2O) emissions. Circles = August sampling and Triangles = November sampling (n = 5), and (B) nitrogen oxide emissions. Circles = NO and Triangles = NO2. (n = 3, except mature forest n = 2). Data is shown as boxplot with the median value indicated by the band near the middle of the box, the first and third quartiles are the top and bottom of the box, respectively, the maximum and minimum values excluding outliers are the whiskers. The effect of forest age is not significant for nitrogen oxide gases examined (p > 0.05; K-W test).

