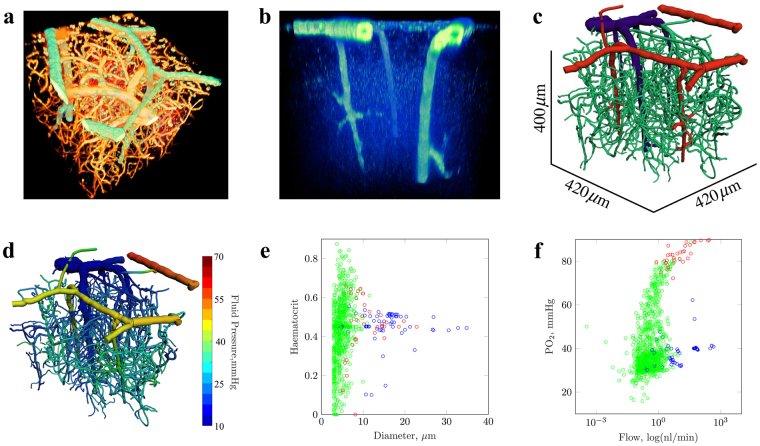
Figure 1.
Mathematical modelling of blood flow in the cortical microvasculature, using 3D confocal imaging data from transgenic mice. (a) A view of the cortical vascular network showing smooth muscle actin-covered vessels (SMA, green), from transgenic expression of m-Cherry, and blood vessel lumen (orange), from exogeneous administration of fluorescent dextran. (b) An enhanced view showing the location of SMA-expressing vessels. (c) The vascular network, following image segmentation, with vessels colour-coded based on classification (red: SMA-expressing arterioles; blue: veins; green: capillaries). (d) Simulated cortical blood pressures within the cortical network. (e) A scatter plot of vessel diameter against simulated, blood vessel haematocrit from our baseline simulation. (f) A scatter plot of volumetric blood flow (nL/min) against intravascular PO2 (mmHg). Data points in (e) and (f) are colour-coded according to vessel classification, as per (c).

