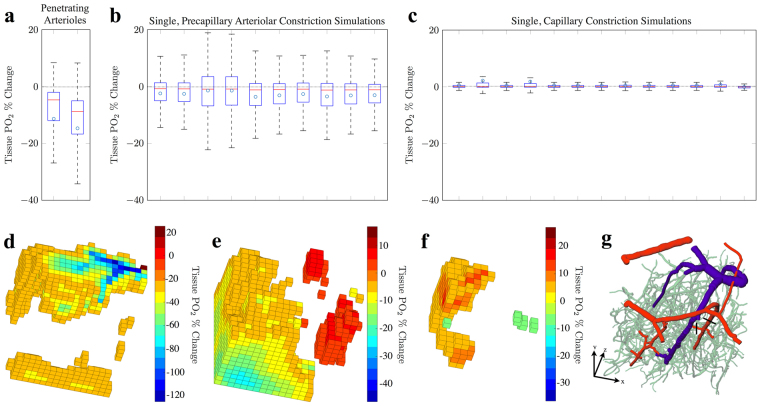
Figure 5.
Simulated single vessel constrictions (a total of 25, with constriction cascade induced by constriction of SMA-covered vessels) and the subsequent changes in global tissue PO2. Box plots indicated the percentage change in tissue PO2, when compared to baseline tissue PO2, as a consequence of singular constrictions of (a) penetrating arterioles, (b) precapillary arterioles and (c) capillaries. (d,e,f) 3-dimensional visualisations of spatial changes in tissue PO2 as a result of constrictions in (d) a penetrating arteriole, (e) a precapillary arteriole and (f) a capillary. (g) 3-dimensional visualisation of the cortical network, in which black lines indicate the initial site of constriction for (d) and (e), and where the capillary constriction in (f) occurred downstream of (e). Note, absolute percentage changes < 20% for (d) and absolute values < 5% for (e) and (f) are not shown, for clarity.

