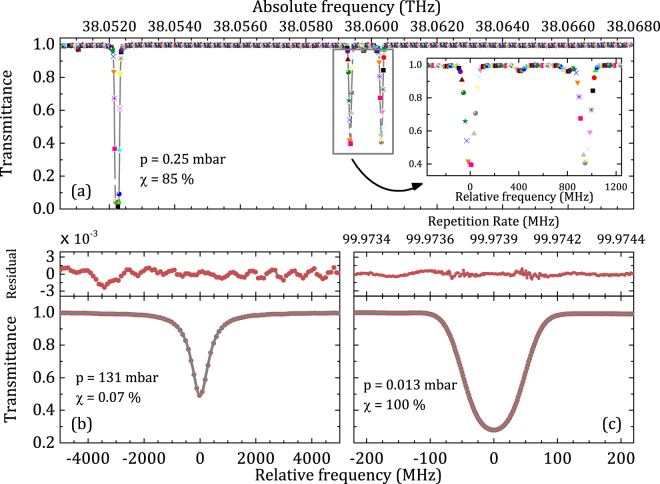
Figure 3.
(a) Absorption spectrum at 298 K of a 85% air-diluted N2O sample at a pressure of 0.25 mbar near 1269 cm−1, with a comb-defined frequency axis. Inset: zoomed-in view of the P(25) doublet, with interleaved spectra for a denser spectral sampling. (b) Absorption spectrum of the P(18) line of N2O with a 0.07% dilution at 131 mbar with a 100-MHz frequency grid (bottom panel) and residuals from a Voigt fitting (top panel). (c) Absorption spectrum of the same line in a pure sample at 0.013 mbar (bottom panel), and residuals from a Gaussian fitting (top panel). The spectrum is in this case acquired by a 4 Hz stepping of the comb repetition frequency (1.5 MHz spaced optical frequency grid). In the figure, χ is the dilution factor.

