Figure 1.

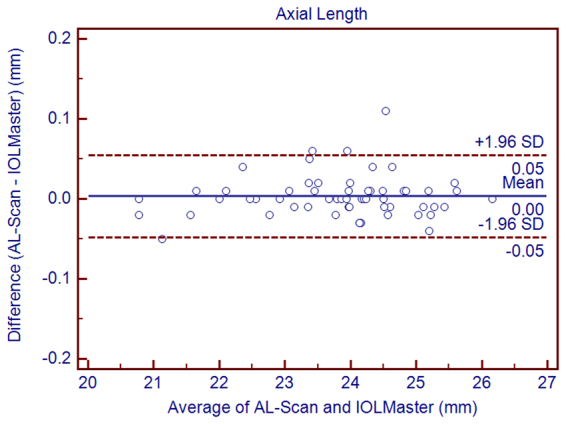
Bland–Altman graphs for pairwise comparisons between the AL-Scan and IOLMaster measuring the axial length in children. The mean difference and 95% limits of agreement are indicated as solid and dashed lines, respectively.

Bland–Altman graphs for pairwise comparisons between the AL-Scan and IOLMaster measuring the axial length in children. The mean difference and 95% limits of agreement are indicated as solid and dashed lines, respectively.