Figure 2.

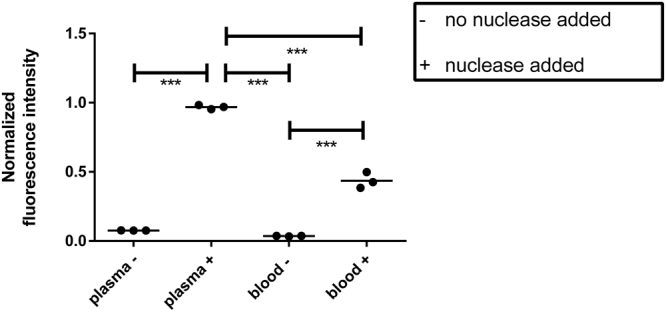
Normalized fluorescence intensity after probe incubation in human blood and plasma. Horizontal line represents the mean. –indicated no nuclease was added. +indicates nuclease was added. **Indicates P < 0.001, ***indicates P < 0.0001.

Normalized fluorescence intensity after probe incubation in human blood and plasma. Horizontal line represents the mean. –indicated no nuclease was added. +indicates nuclease was added. **Indicates P < 0.001, ***indicates P < 0.0001.