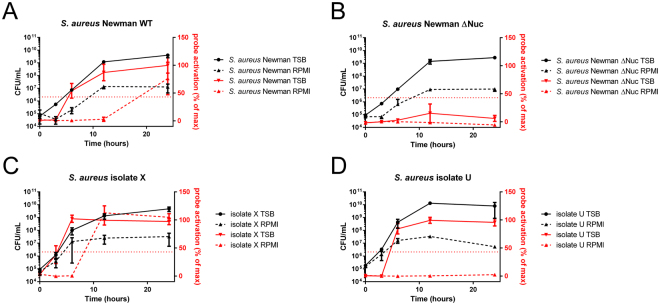
Figure 4.
Activation of the P2&3 TT-probe by S. aureus grown to different stages in TSB and RPMI. Left Y-axis and lines in black indicate CFU per mL, right Y-axis and lines in red indicate probe activation as a percentage of the maximum activation. All experiments were done in triplicate, and the plots present the average numbers of the measurements. Capped lines indicate standard deviation. Strains included were: A, S. aureus Newman wild-type; B, nuclease deficient S. aureus mutant (Δnuc); C, S. aureus clinical isolate X29; and D, S. aureus clinical isolate U29.

