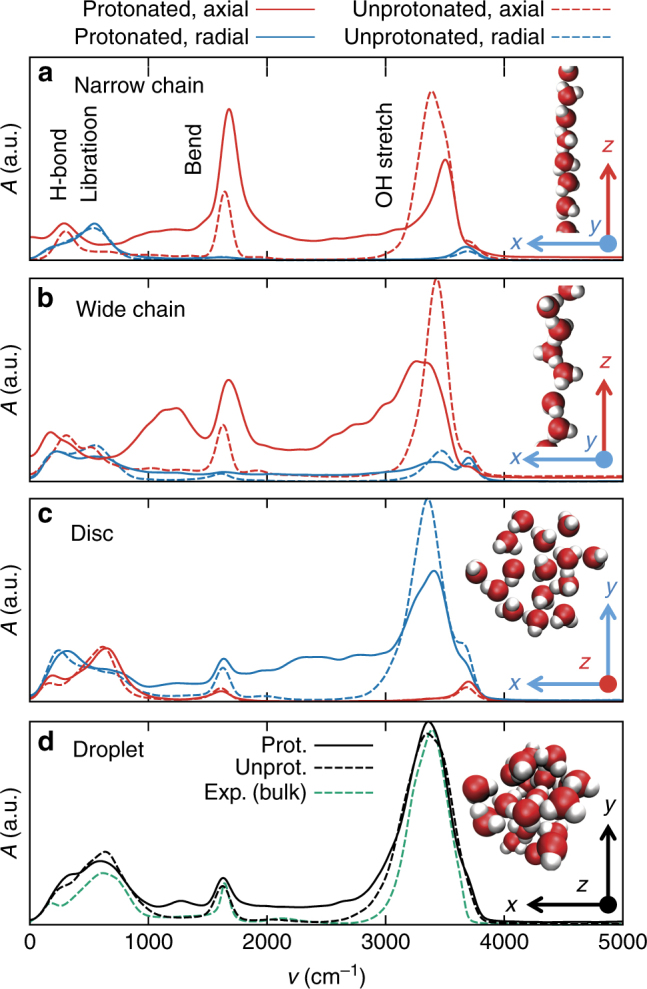
Fig. 1.

Simulated spectra and snapshots. Anisotropic infrared spectra computed from ab initio trajectories for a a narrow chain, b a wide chain, c a disc, and d a droplet of water with (solid lines) and without (dashed lines) an excess proton. Red lines show the spectrum for an E field in the axial z direction, blue lines the spectrum for an E field in the radial xy directions, where radial components are averaged. For the droplet, all directions are averaged. In d, the experimental bulk water absorption spectrum at T = 25 °C31 is included (green dashed line). In each panel, the intensities of the computed spectra are drawn to scale
