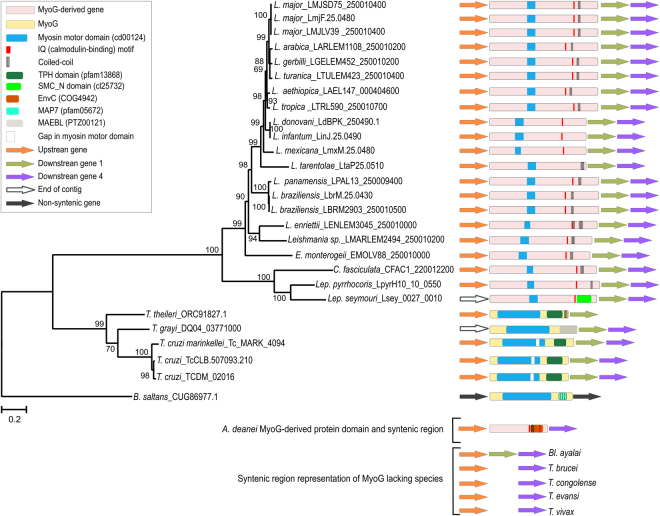
Figure 4.
Phylogenetic tree of kinetoplastid MyoG and MyoG-derived proteins. The evolutionary history was inferred by using the maximum likelihood method based on the JTT + G (4 categories) + I model. Bootstrap values from 1,000 replicates are shown next to the branches. The tree is drawn to scale, with branch lengths measured in the number of substitutions per site. The analysis involved 28 amino acid sequences. There were 568 positions in the final dataset. B. saltans MyoG was used to root the tree. Sequences are identified by the name of species and the GenBank or TritrypDB accession number. Protein domain architectures of sequences are shown together with a representation of their genomic context. Due to the high divergence, the A. deanei MyoG-derived protein was not included in the phylogeny.

