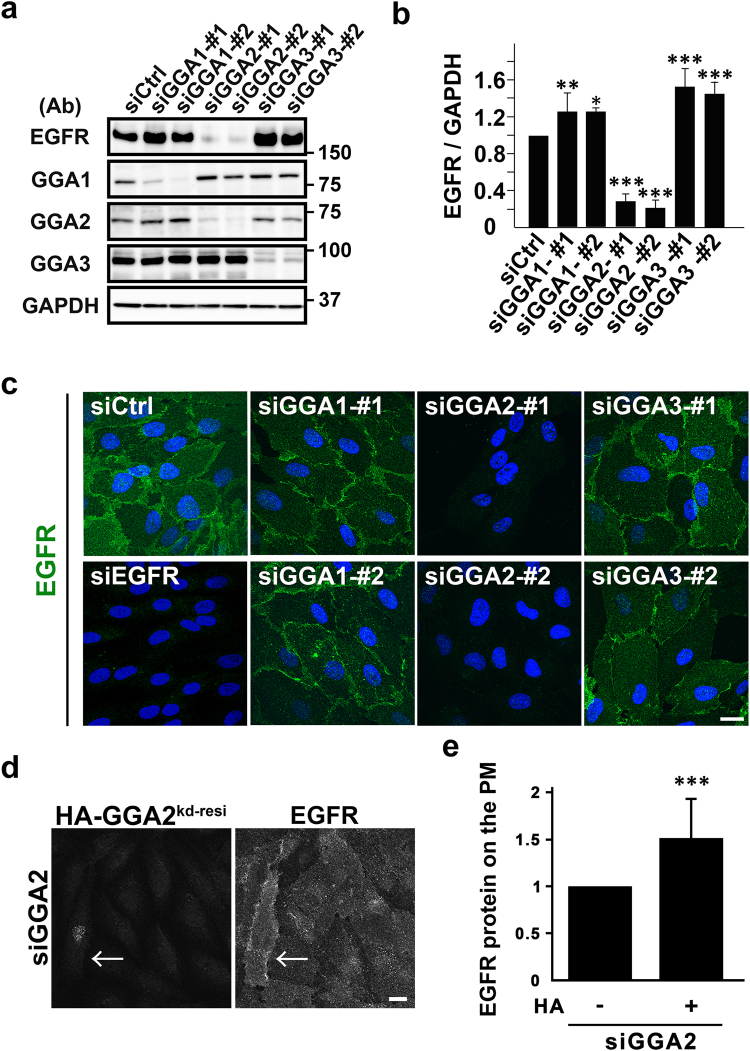
Figure 1.
GGA2-depletion causes a drastic decrease in the EGFR protein expression. (a) Total lysates from ARPE-19 cells transfected with control (siCtrl), GGA1, GGA2, or GGA3 siRNAs were immunoblotted using indicated antibodies (Ab). Two sequences of siRNA (#1 and #2) were used for each GGA. Uncropped blots are presented in Supplementary Fig. 6. (b) Band intensities for EGFR were quantified in three or four experiments and mean values ± standard deviations (SD) were plotted. Differences between each GGA siRNA and siCtrl were analyzed by one-way ANOVA (P < 0.001) and Tukey’s honestly significant difference test (*P < 0.05, **P < 0.01, and ***P < 0.001). (c) Cells were treated with indicated siRNAs and were then fixed for immunofluorescence microscopy using anti-EGFR antibody. Nuclei were stained with Hoechst 33342 (blue); Bar, 20 μm. (d) GGA2-depleted cells re-expressing HA fused with siRNA-resistant full length GGA2 (HA-GGA2kd-resi) were double immunolabeled with anti-HA and -EGFR antibodies. Signal intensity for EGFR was enhanced to detect differences. The arrow indicates a cell expressing HA-GGA2kd-resi. Bar, 20 μm. (e) EGFR signal on the plasma membrane in HA-positive (n = 95) and -negative cells (n = 177) was quantified. Statistical analysis was performed using Student’s t-test (***P < 0.001). See Materials and Methods for details.

