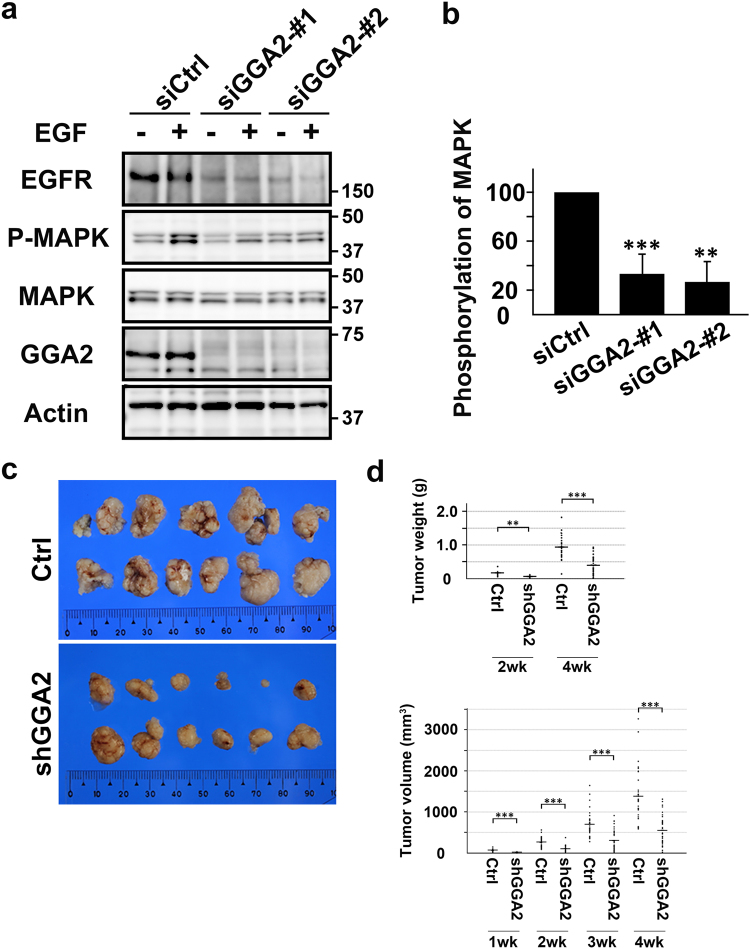
Figure 6.
EGF-induced EGFR signaling and cell growth are impaired in GGA2-depleted cells. (a) Control (siCtrl) and GGA2-depleted (siGGA2-#1 and siGGA2-#2) ARPE-19 cells were treated with (+) or without (−) 10 nM EGF for 5 min and were then lysed for western blot analyses with antibodies against EGFR, phosphorylated MAPK (P-MAPK), MAPK, GGA2, or tubulin. Uncropped blots are presented in Supplementary Fig. 7. (b) Increase in the ratio of P-MAPK to MAPK after EGF stimulation was calculated and normalized to the value of siCtrl. Mean (±SD) of three experiments were plotted. Statistical difference between the control and each GGA2 siRNA was identified using Student’s t-test (**P < 0.01 and ***P < 0.001). (c) Control (Ctrl) or GGA2-depleted (shGGA2) LoVo cells were transplanted into nude mice. Tumors were excised at 4 weeks after transplantation. (d) Tumor weights and volumes were measured at the indicated time points and displayed as dot plots (mean [horizontal bar] ± SD). Statistical analyses were performed using Mann-Whitney U-test; ***P < 0.001.

