Figure 1.
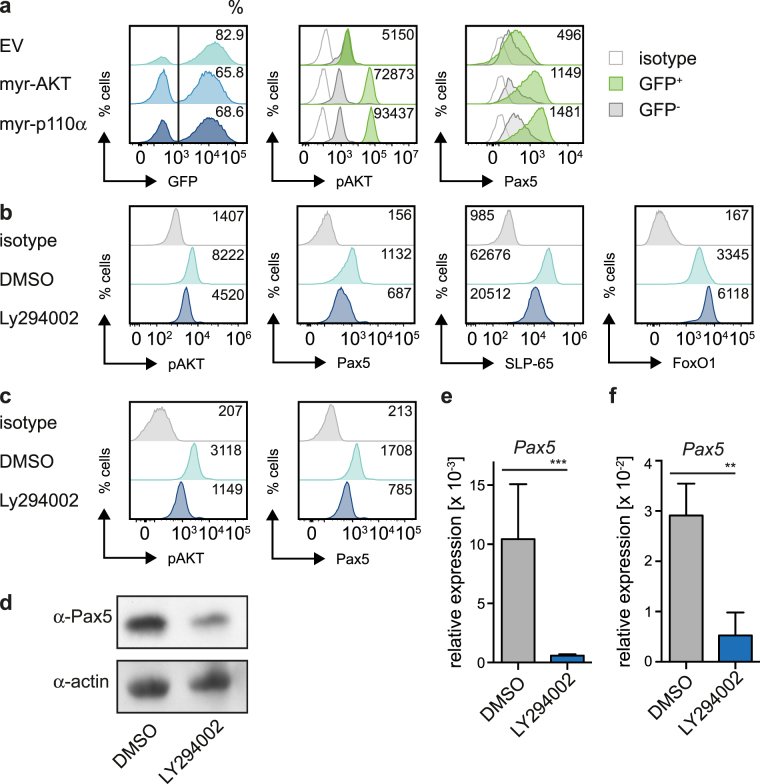
PI3K regulates Pax5 expression. (a) Cells from a bone marrow (bm)-derived wildtype (wt) pre-B cell culture were transduced with constitutively active forms of AKT (myr-AKT), p110α (myr-p110α), or as control with empty vector (EV) and analyzed for pAKT and Pax5 expression by intracellular FACS. If not indicated otherwise, numbers in the histograms state the mean fluorescence intensity (MFI) of the respective GFP+ populations. (b) Cells from a bm-derived wt pre-B cell culture were treated with LY294002 or DMSO for 16 h and analyzed for pAKT, Pax5, SLP-65 and FoxO1 expression by intracellular FACS. (c) Cells from a SLP-65-deficient pre-B cell line were treated with LY294002 or DMSO for 12 h and pAKT and Pax5 expression was analyzed by intracellular FACS. (d) Murine mature B cells (CD43−) were isolated and treated with LY294002 or DMSO for 12 h, lysed and subjected to immunoblot for analysis of Pax5 expression. Actin served as a loading control. For original full-length blots see Fig. S1e. (e) Total RNA of SLP-65-deficient cells treated for 12 h with LY294002 or DMSO was isolated. Gapdh and Pax5 mRNA-levels were detected with specific primers by qRT-PCR using the SYBR-Green detection method. Results are shown as mean ± SD of 2 independent experiments, run as duplicates. Statistical significance was calculated using the t-Test. (f) Total RNA of murine mature B cells treated with LY294002 or DMSO for 12 h was isolated. Gapdh and Pax5 mRNA-levels were detected with specific primers by qRT-PCR using the SYBR-Green detection method. Results are shown as mean ± SD of 2 independent experiments, run as duplicates. Statistical significance was calculated using the Mann-Whitney Test. Data shown in Fig. 1a–d are representative of at least 3 independent experiments.

