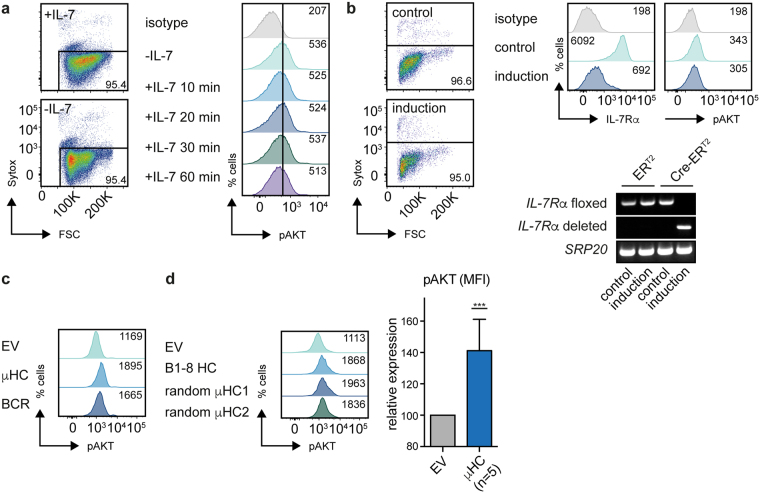
Figure 2.
Pre-BCR activates PI3K signaling, whereas IL-7R does not. (a) Cells from a bm-derived wt pre-B cell line were cultured overnight in presence or absence of IL-7. Viability of the cells was assessed by Sytox staining (left panel). Levels of pAKT were measured by FACS at the indicated time points following addition of IL-7 (10 ng/ml) (right panel). Numbers in the dot plots indicate the percentages, numbers in the histogram plots indicate the MFI. (b) Cells from an IL-7Rαfl/fl bm-derived pre-B cell line were transduced with a 4-hydroxytamoxifen (4-OHT)-inducible form of Cre-recombinase (Cre-ERT2) or ERT2 as EV and treated with 4-OHT (induction) or EtOH (control) for 48 h. Viability of the cells was assessed by Sytox staining (left). Surface levels of IL-7Rα as well as intracellular levels of pAKT were determined by FACS analysis (right, top). Additionally, Cre-mediated deletion was confirmed by PCR using specific primers detecting the floxed or deleted IL-7Rα allele (right, bottom). PCR for SRP20 was used as loading control. For original full-length gel pictures see Figure S2b. (c) Cells from a Rag2-deficient pro-B cell line were retrovirally transduced with μHC (B1-8 HC), or μHC + λLC (BCR) and levels of pAKT were measured at day 2 upon transduction by FACS. Numbers in the histogram plots indicate the MFI. (d) Indicated μHCs were introduced into cells from a Rag2-deficient pro-B cell line as in (c) and analyzed at day 1 post transduction for levels of pAKT by FACS (left). Numbers in the histogram plots indicate the MFI. Indicated μHCs were expressed at least 3 times and the average MFI of pAKT FACS-analysis over all experiments is shown (right). Statistical significance was calculated using the t-Test. Data shown in Fig. 2a,b are representative of at least 3 independent experiments.

