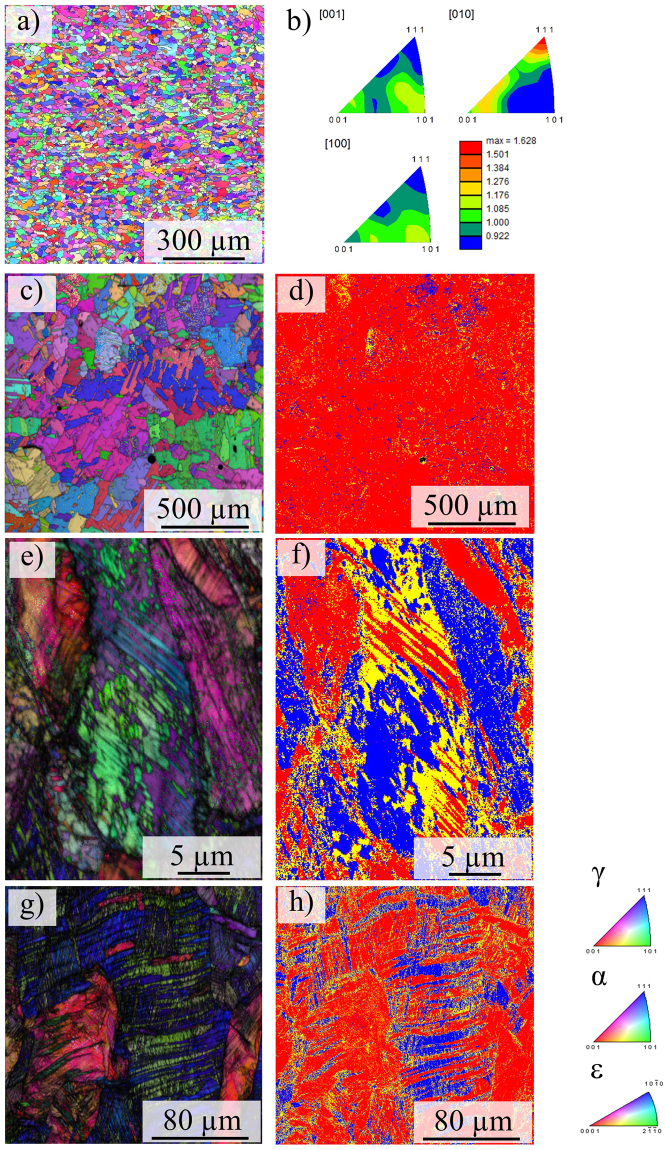
Figure 3.
EBSD micrographs (inverse pole figure maps, color coding shown in the lower right) of the tensile specimens in (a) the as-built condition and (c) the solution heat-treated condition, (b) inverse pole figures and corresponding intensity scale bar corresponding to (a), (d) phase map corresponding to (c), (e) the tensile tested as-built and (g) the solution heat-treated and tensile tested condition, (f and h) show the phase distribution corresponding to (e and g), respectively (color coding is red: fcc, blue: bcc and yellow: hexagonal phase). Build direction and loading direction, respectively, are vertical.

