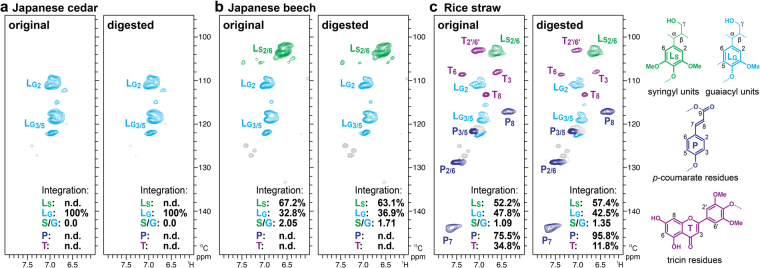
Figure 3.
2D 1H–13C correlation (HSQC) spectra of acetylated samples of lignin-enriched cell walls from original and digested lignocellulose diets fed to C. formosanus termite workers. Lignin aromatic sub-regions are shown for (a) Japanese cedar (softwood), (b) Japanese beech (hardwood), and (c) rice straw (grass) diets. Volume integrals are given for the major lignin aromatic units that are color-coded to match their assignments in the spectrum. The percentages noted in each spectrum are integrals relative to the sum of the syringyl and guaiacyl lignin unit signals (LS + LG = 100%). For signal assignments and structure abbreviations, also see Table S2. n.d., not detected.

