Fig. 3.
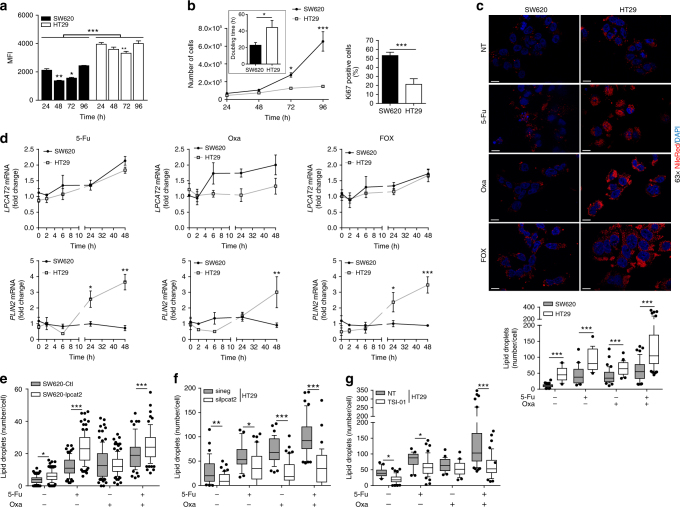
LPCAT2 supports 5-Fu and Oxa-induced LD production. a SW620 and HT29 cells were stained with Bodipy 493/503 and analysed by flow cytometry after 24, 48, 72 and 96 h of seeding. Bodipy 493/503 median of fluorescence intensity (MFI) was used to assess LD content. The multiple Student t test was used to compare cell lines at each time point and a two-way ANOVA with Bonferroni correction was used to compare MFI for each cell line at each time point (MFI at 24 h being used as control). ***p < 0.001. Error bars denote s.e.m. b SW620 vs HT29 cell growth curves (left panel). Doubling time was determined by the following equation: DT = (T − T0) × (log2) / (logN − logN0) (insert). The percentage of Ki67-positive cells was determined by flow cytometry after 48 h of seeding (right panel). Growth curve p values were determined by a two-way ANOVA with Bonferroni correction and the DT and percentage of Ki67-positive cells using the Student t test. *p < 0.05, ***p < 0.001. Error bars denote s.e.m. c Cells were stained with Nile red 48 h after vehicle (DMSO, NT), 5-Fu (10 µM), Oxa (10 µM) or FOX (5-Fu + Oxa, 10 µM each) treatments. The number of LDs per cell (lower panel) was obtained by counting red lipid bodies on merged pictures (300 cells per condition) (upper panel) (scale bar = 10 µm). Whiskers denote 1st and 99th percentiles. P values were determined by the multiple Student t test. ***p < 0.001. d Relative LPCAT2 and PLIN2 mRNA expression levels at 0, 2, 6, 24 and 48 h after vehicle, 5-Fu, Oxa or FOX treatments. ACTB was used as a housekeeping gene to calculate ΔCt. The data are expressed as fold changes calculated with 2-(ΔCt treatment/ΔCt vehicle). The data are the results from three independent experiments. P values were determined by two-way ANOVA with Bonferroni correction. *p < 0.05, **p < 0.01, ***p < 0.001. Error bars denote s.e.m. e–g LD content at 48 h of chemotherapy treatments in (e) SW620-Ctl vs SW620-lpcat2 cells; (f) HT29 cells transiently transfected with sineg vs. silpcat2; (g) vehicle (DMSO) vs. TSI-01 (10 µM) co-treatment. Whiskers denote 1st and 99th percentiles. P values were determined by the multiple Student t test. *p < 0.05, **p < 0.01, ***p < 0.001

