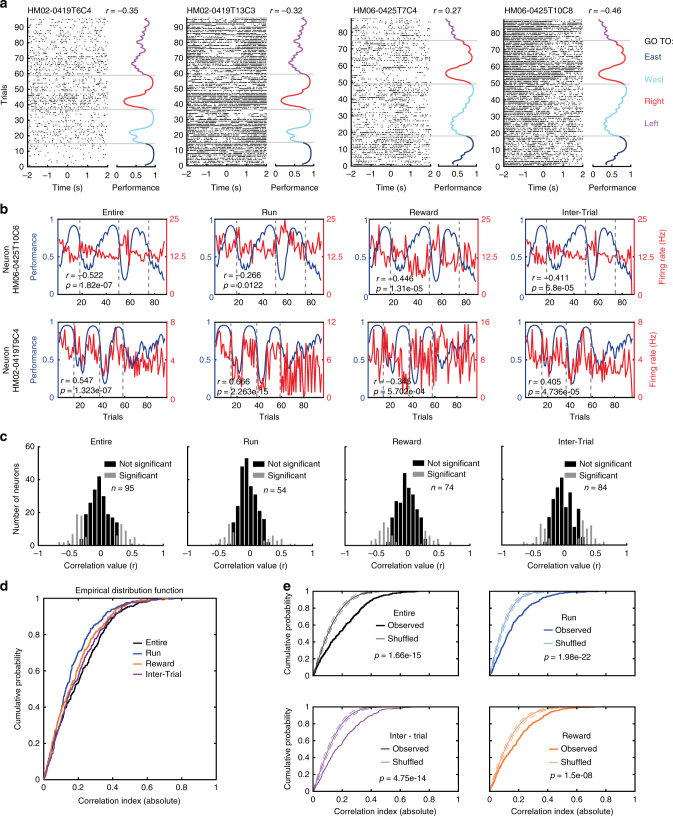
Fig. 2.
The firing rate of individual neurons correlates with task-performance of the animal during multiple rule changes. a Individual spikes (black ticks) are plotted around the time of reward activation (0 s). The corresponding behavioural performance is plotted at the right of the raster plot and colour coded according to rules. Note that spike activity is modulated by the performance. The correlation value (r) between trial-by-trial firing rate and performance is indicated (Spearman correlation). Grey lines denote rule changes. b The firing rate of two neurons (Neuron HM06-0425T10C6 and Neuron HM02-0419T9C4) are negatively or positively correlated to performance during the task irrespective of the trial time segment. c Histograms of correlation values (firing rate versus task-performance) for 300 recorded neurons and for different trial segments. n represents number of neurons with firing rates significantly correlated to task performance (Spearman´s correlation, p < 0.05 after Bonferroni–Holm correction). d Cumulative distribution functions of individual neurons‘ correlation values for different trial segments. e Comparison of observed and shuffled cumulative distribution functions of individual neurons’ correlation values for different trial segments. Dotted lines indicate confident intervals at 2.5 and 97.5 %. Note that the firing rates of some neurons are correlated with task performance during all task periods

