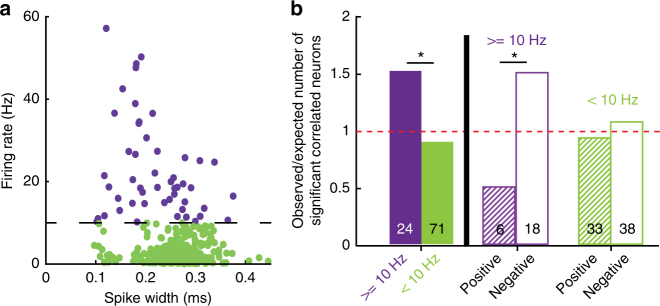
Fig. 3.
High-firing neurons are negatively correlated with task performance. a Scatter plot for firing rates versus spike width of all recorded neurons. Threshold for separation of high (purple) and low (green) firing neurons was arbitrarily set at 10 Hz. b Comparison of different groups for neurons with significant correlation between firing rate and task-performance of the animal. Y-axis indicates the ratio between observed number of significantly correlated neurons in a group and numbers expected by chance. Numbers at the bottom of each bar indicate n of each group. * indicates p < 0.05; Χ2 test. “ ≥ 10 Hz” (purple) and “ < 10 Hz” (green) indicate neurons with respective firing rates above or below 10 Hz

