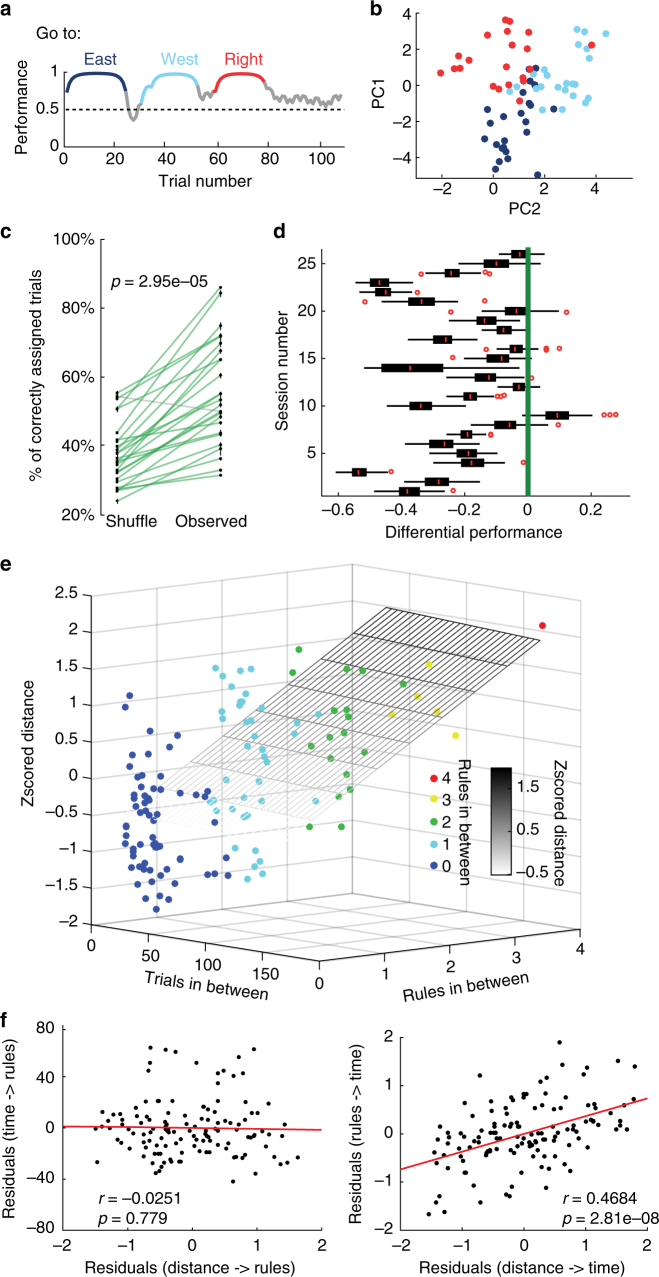
Fig. 4.
Firing rates of neurons change according to different rules followed by the animal. a During a behavioural session, the animal successfully adjusted its performance during three different rules presented consecutively. Highlighted episodes represent the trials used to generate the representations of network states. b Projection of multi-unit activity (n = 24 neurons) onto the two highest principal components for the session shown in (a). c Comparison between the performance of K-means clustering on the observed firing rates versus the performance of the k-means clustering on the shuffled firing rates (p = 2.95e−5, Wilcoxon signed-rank. d Normalised distributions of the performance (shuffle data minus observed data) for each of the 26 sessions, using the centre of mass as a starting point of the k-mean clustering algorithm. The green line references performance of the observed data. Red circles denote outliers. Box plots show median, 25th and 75th percentile. e Three-dimensional plot of a multiple linear regression with the z-scored Euclidean distance between clusters as the dependent variable. The regressors are the number of trials in between and the number of rules in between. The plane is the resulting equation of the regression. Note that the distances are better explained by the rules (p = 2.81e-08) than the number of trials (p = 0.779) in between. f Partial correlation plots of the distance between the centre of masses of the rules and the number of trials taking into account the number of rules (left) and the distance between centre of masses of the rules and the number of rules taking into account the number of trials (right)

