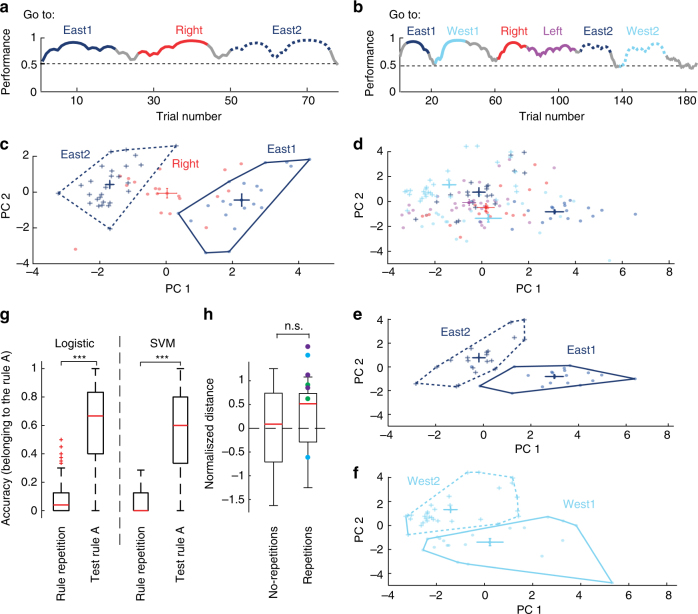
Fig. 5.
The repeated presentation of the same rule is not accompanied with a reemergence of the same prefrontal network state of firing. a Behavioural session during which the animal performed successfully during three consecutive rules; the first and the third rule applied were identical (go east). b Behavioural session with 7 rules presented. Two rules are presented twice at different times (go east and go west). Highlighted performance represents the trials used to calculate firing-states. c Projection of multi-unit activity (n = 12 neurons) onto the two highest principal components for the session shown in (a). d Projection of multi-unit activity (n = 18 neurons) onto the two highest principal components for the behavioural session shown in (b). Network states of different rules are colour coded and the centre of mass of each of them is presented with error bars. e, f Isolated and non-overlapping network states of two different rules (top and bottom), which were presented twice during the session example in b. Note that the rules presented twice at different times during the same session (dark and light blue, straight and dotted contours) resulted in different firing states of the network. g Comparison of the accuracy of two classifiers (logistic and support vector machine) trained to detect a given rule ‘A’. Note that the classifiers can detect trials belonging the rule ‘A’, but failed at detecting its repetition ‘A°’ as part of rule ‘A’ (p < 1 × 10e−20 for both logistic and SVM classifiers, Wilcoxon rank-sum test). Box plots show median, 25th and 75th percentile. h Box plot indicating the normalised Euclidean distance measured between the centres of rules without dimensionality reduction. Red line indicates the median. Coloured dots indicate different animals (Green = HM02, Blue = HM06 and purple = HM07). Note that distances of rules with or without repetitions of the same rule were not significantly different (p = 0.58, Wilcoxon rank-sum test). Euclidean distances were normalised to account for a different number of rules which were presented between the same rule (see Methods). Box plots show median, 25th and 75th percentile

