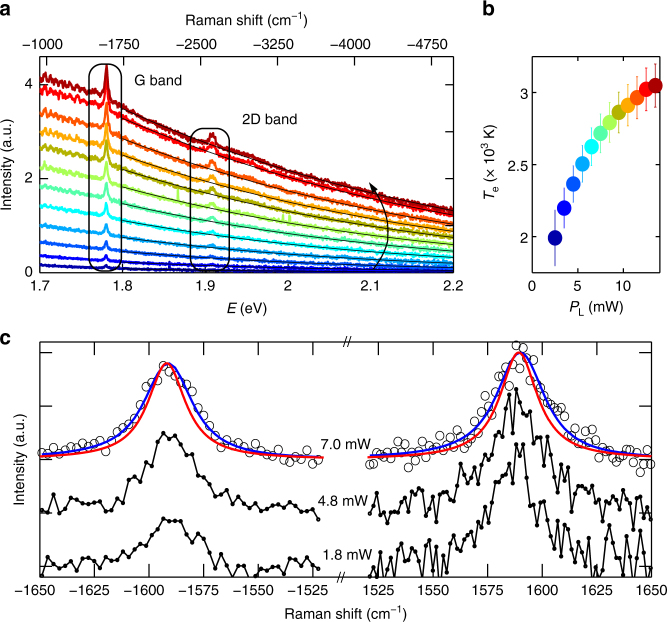
Fig. 1.
Spectral response of SLG under ultrafast excitation. a AS Raman spectra under ultrafast excitation for laser powers increasing along the arrow direction. The PL-dependent background is fitted by thermal emission (Eq. 1, black lines) resulting in Te in the 1700–3100K range. b Te as a function of PL. Error bars represent the 95% confidence bounds of the best fit. c Background subtracted, AS and S G peak (in black, normalized to the corresponding S maximum) measured as function of PL in the range mW (corresponding to K). Three representative PL values are shown. Best fits of the G peak (blue line), obtained as a convolution of a Lorentzian (red line) with the IRF are also reported for the largest PL value

