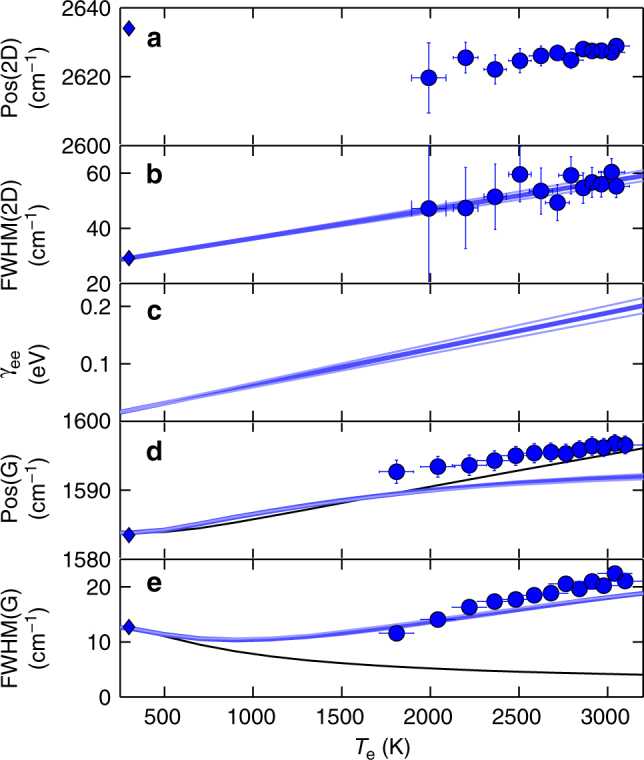
Fig. 3.

Comparison between theory and experiments. a Pos(2D), b FWHM(2D), d Pos(G), e FWHM(G) as a function of Te for ps-excited Raman spectra. Error bars represent the 95% confidence level in the best fitting procedure. Solid diamonds in a,b,d,e represent the corresponding CW measurements. FWHM(2D) are used to determine the e–e contribution (γee) to the Dirac cones broadening, shown in c (blue lines). Pos(G) and FWHM(G) are compared with theoretical predictions accounting for e–ph interaction in presence of electronic broadening (an additional RT anharmonic damping ∼2 cm−1 10 is included in the calculated FWHM(G)). Black lines are the theoretical predictions for γee = 0 eV, while blue lines take into account an electronic band broadening linearly proportional to Te (γee = αekBTe). From the fit of γee in c, we get = 0.51 cm−1K−1 (thickest blue line). Values of = 0.46,0.55 cm−1K−1, corresponding to 99% confidence boundaries, are also shown (thin light blue lines)
