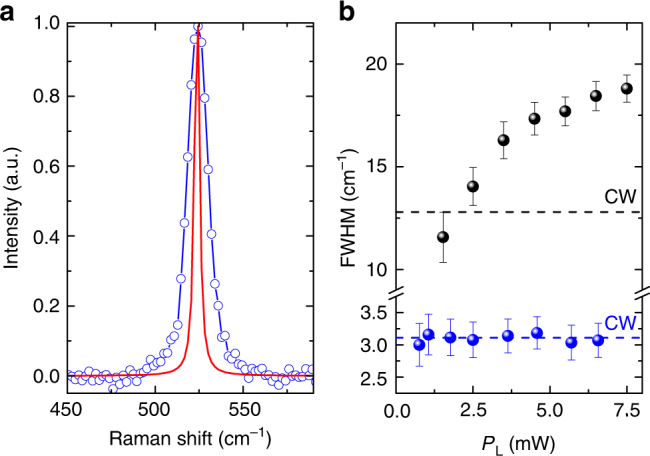
Fig. 6.

Raman response of Si for pulsed laser excitation. a Raman spectrum of Si measured for ultrafast laser excitation and 6.6 mW average power. (blue line) Lorentzian fit. (red line) laser bandwidth deconvoluted spectrum. b FWHM(Si) as a function of PL (blue symbols) does not show any deviation from the CW FWHM(Si) (dashed blue line). FWHM(G) under the same excitation conditions (black symbols) deviates from the CW regime (dashed black line). Error bars represent the 95% confidence level of the best fit of the Si (a) and SLG (G band) peaks
