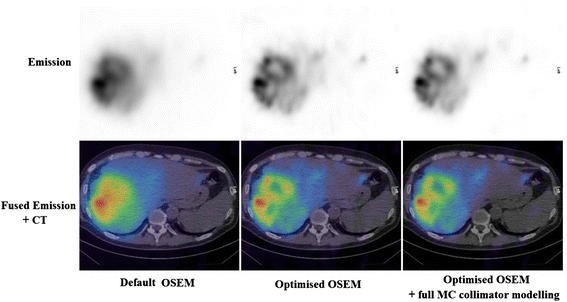
Fig. 4.

Transaxial slices showing distribution of microspheres in the liver of a patient. Left: default OSEM (2 iterations, 10 subsets); middle: optimised OSEM (5 iterations, 15 subsets); right: optimised OSEM with full MC collimator modelling

Transaxial slices showing distribution of microspheres in the liver of a patient. Left: default OSEM (2 iterations, 10 subsets); middle: optimised OSEM (5 iterations, 15 subsets); right: optimised OSEM with full MC collimator modelling