
Fig. 4.
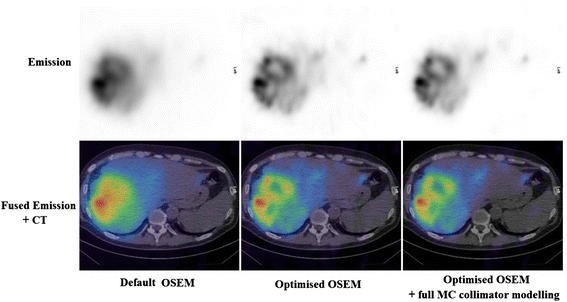
Transaxial slices showing distribution of microspheres in the liver of a patient. Left: default OSEM (2 iterations, 10 subsets); middle: optimised OSEM (5 iterations, 15 subsets); right: optimised OSEM with full MC collimator modelling
Official websites use .gov
A
.gov website belongs to an official
government organization in the United States.
Secure .gov websites use HTTPS
A lock (
) or https:// means you've safely
connected to the .gov website. Share sensitive
information only on official, secure websites.
Transaxial slices showing distribution of microspheres in the liver of a patient. Left: default OSEM (2 iterations, 10 subsets); middle: optimised OSEM (5 iterations, 15 subsets); right: optimised OSEM with full MC collimator modelling