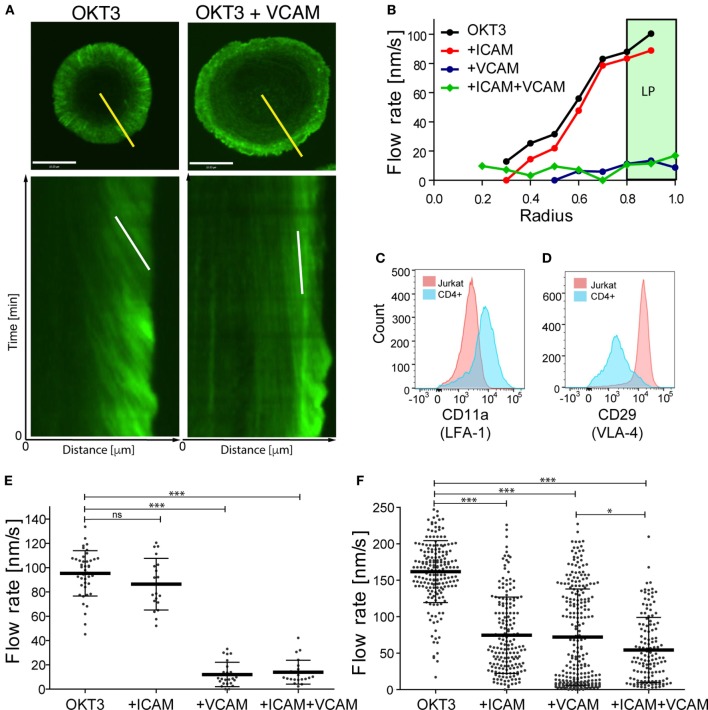
Figure 1.
Integrin engagement slows actin flow. Jurkat T lymphoma cells and primary human CD4+ T cell blasts were allowed to interact with coverslips coated with anti-CD3 (OKT3) plus ICAM-1, VCAM-1, or both, and imaged for 4 min. (A) Still images of responding Jurkat cells stimulated on coverslips coated with anti-CD3 alone (left) or in the presence of VCAM-1 (right), together with corresponding kymographs of F-actin dynamics generated along the yellow lines. The white lines in the kymographs show example slopes used to calculate actin flow rates. (B) Kymographic analysis of F-actin features in Jurkat cells, showing the distribution of F-actin velocity across the immunological synapse (IS). The marked area displays the peripheral lamellipodial region (LP). (C,D) Surface expression of integrin LFA-1, as detected by CD11a staining and VLA-4, as detected by CD29 staining on Jurkat T cells (pink) and primary human CD4+ T cell blasts (blue). (E,F) Actin flow rates in the LP region for Jurkat cells (E) and primary human CD4+ T cell blasts (F). Error bars show mean ± SD. *p < 0.05, ***p < 0.001. Scale bar = 10 µm.

