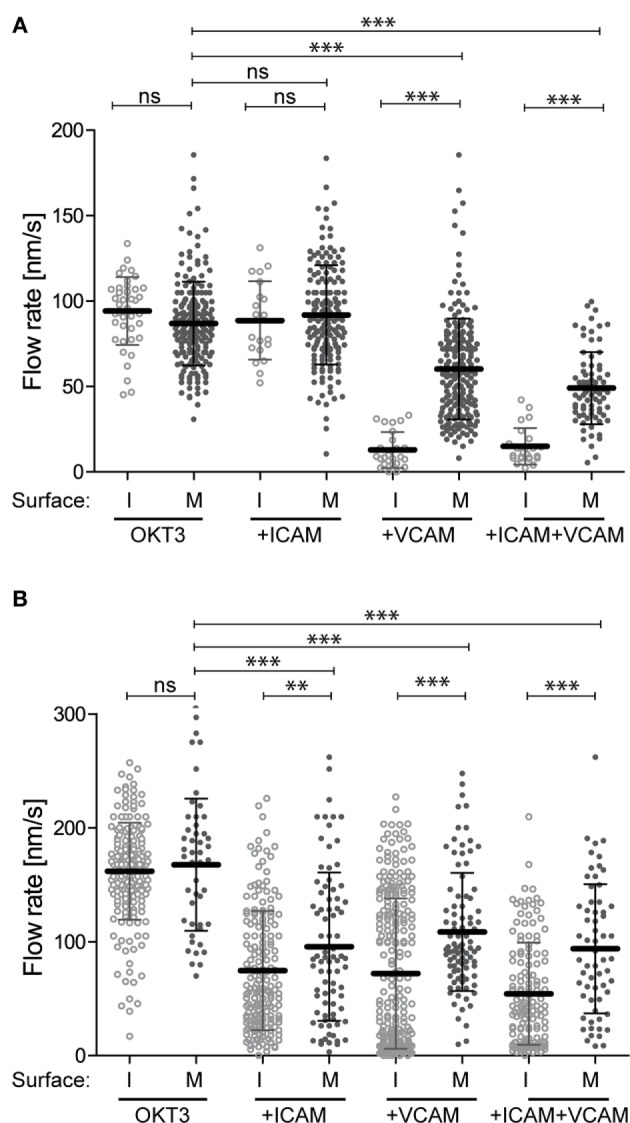
Figure 2.

Integrin–ligand mobility influences actin flow. Jurkat T cells (A) and primary human CD4+ T cell blasts (B) were allowed to interact with mobile bilayers functionalized with anti-CD3 (OKT3) alone, together with ICAM-1, VCAM-1, or both. Actin flow rates in the LP region were analyzed as described for Figure 1. Solid dots show flow rates from cells responding to mobile ligand (M). Open dots show data for cells responding to immobile ligands (I). Data for immobile surfaces are from Figure 1, plotted here to facilitate comparison. Error bars show mean ± SD. **p < 0.01, ***p < 0.001.
