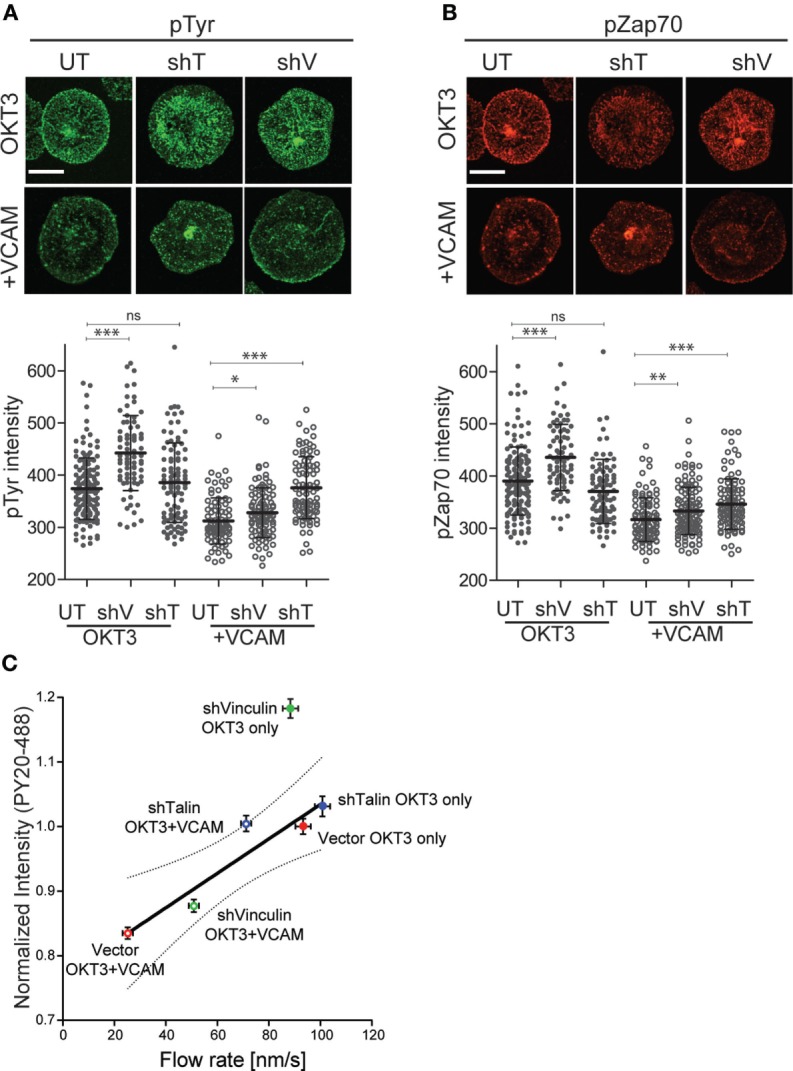
Figure 8.

Clutch molecules modulate T cell receptor (TCR) signaling. Jurkat T cells, untransduced (UT), or suppressed for talin (shT) or vinculin (shV) were stimulated on coverslips coated with OKT3 (10 µg/ml) in the presence and absence of VCAM-1 (2 µg/ml). After 5 min, cells were fixed and stained for phospho-tyrosine (A) or phospho-ZAP70 (Y319). (B) Quantitative analysis of labeling intensity is shown below each image panel. Mean ± SD of measurements from at least 50 cells is shown. *p < 0.05; ***p < 0.001. Scale bars = 10 µm. (C) Normalized phospho-tyrosine labeling intensity from (A) was plotted against actin retrograde flow rates from Figure 7B. Linear regression analysis showed vinculin-suppressed cells responding to OKT3 alone to be an outlier. Excluding that data point resulted in a strong correlation R2 = 0.90. Dotted line shows the 95% confidence interval. Data represent means ± SEM from three independent experiments.
