Figure 7.
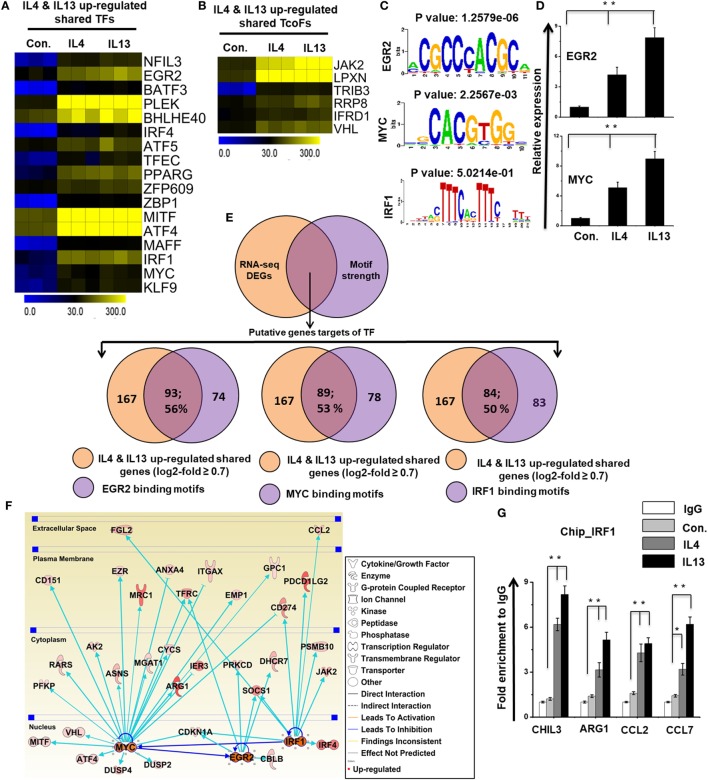
Differences in the expression of selected transcription factors (TFs) and transcription co-factors (TcoFs) between interleukin (IL)-4 and IL-13-treated bone marrow-derived macrophages (BMDMs). (A,B) Heat map representation of TFs and TcoFs that were commonly upregulated in IL-4 and IL-13-treated BMDMs, respectively. (C) Patterns of TF motif enrichment within the promoters of the common upregulated genes in IL-4 and IL-13-treated BMDMs. (D) Validation of commonly upregulated TFs in IL-4 and IL-13-treated BMDMs. Gene expression was normalized to glyceraldehyde-3-phosphate dehydrogenase transcript levels. **P < 0.001 compared with the control. The data represent three independent biological experiments. (E) Venn diagrams of common upregulated genes associated with EGR2, MYC, and IRF1 in IL-4 and IL-13-treated BMDMs. (F) The activity of the highly associated M2-associated genes EGR2, MYC, and IRF1 led to the activation of this network, as assessed using the ingenuity pathway analysis molecule activity predictor in IL-4 and IL-13-treated BMDMs. (G) Chromatin Immunoprecipitation (ChIP) assay to determine the binding of IRF1 to target genes. The ChIP-enriched samples were subjected to quantitative PCR with selected genes promoters. The graphs represent the mean fold values of enrichment relative to IgG control from three independent experiments. *P ≤ 0.01 and **P ≤ 0.001 compared with the control.

