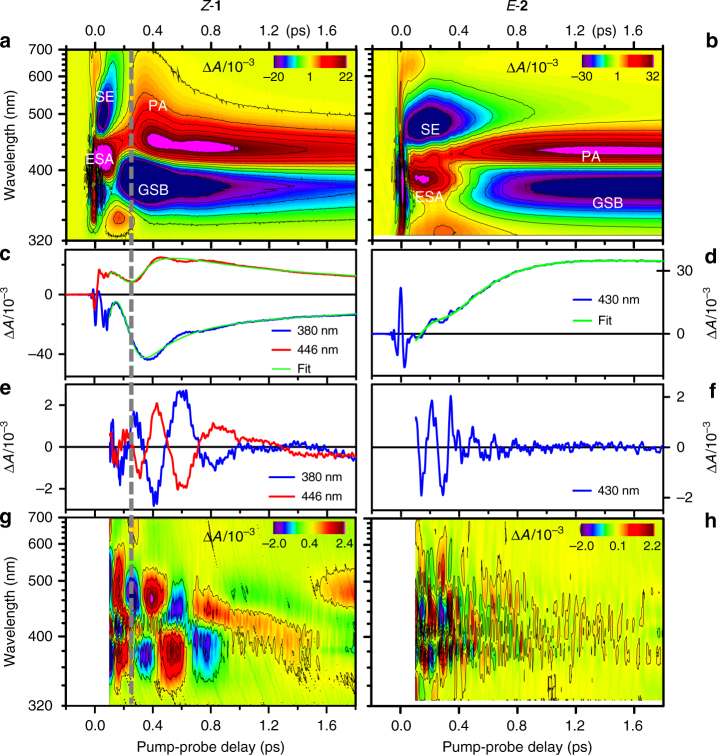
Fig. 2.
Transient absorption spectroscopy of Z-1 and E-2 upon resonant excitation. a, b 2D map representations of the differential absorption (ΔA) coded in false colors, as a function of probing wavelength (nm) and pump-probe time delay (ps). The TA data are obtained upon excitation with a resonant, 8.5 fs pump pulse of a methanol solution of Z-1 (left column) and E-2 (right column). c Kinetic traces illustrating the signal detected at the 380 nm (blue trace) and 446 nm (red trace) probe wavelengths for Z-1, and the result of the 2D map global fit (green) at the same wavelengths. d Same for E-2, at the 430 nm probing wavelength. e, f The corresponding residuals reveal the oscillatory signatures of the nuclear motions. g, h 2D map representation of the residuals of the global fit of both TA data sets. Time delays shorter than 0.1 ps are disregarded (see Methods section). Fourier transformation of these maps along the time axis reveals the power spectra of the oscillatory signals, interpreted as vibrational spectra (Fig. 3). The vertical dashed line at 250 fs across a, c, e, g indicates the moment of impulsive S1 decay of 1 at the CInt

