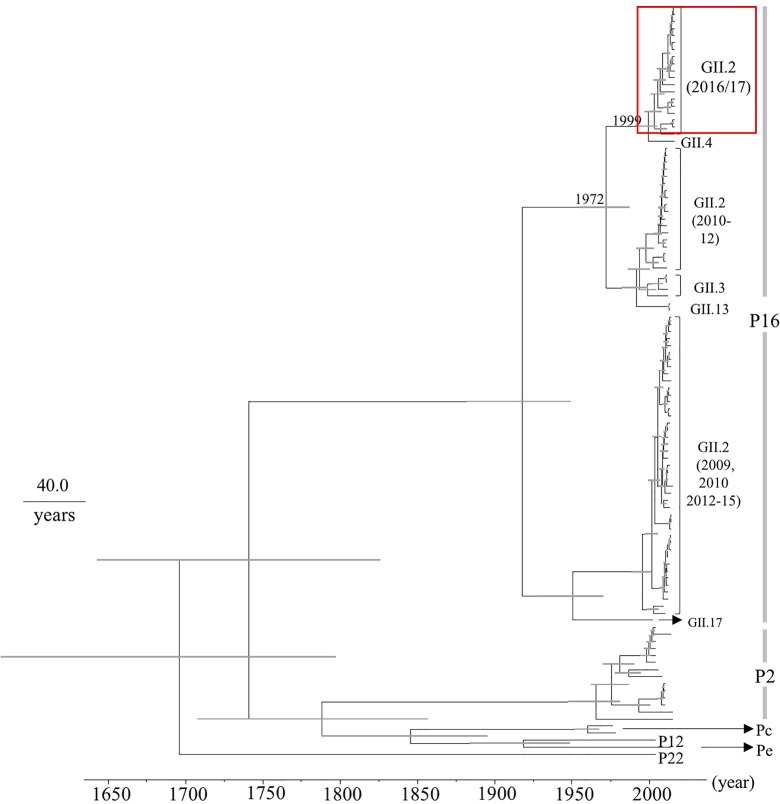
FIGURE 2.
Phylogenetic tree for the RdRp region in the HuNoV strains was constructed using the Bayesian Markov chain Monte Carlo method. The scale bar represents time (years). Gray bars indicate the 95% HPD for the branched year. The genotypes of the VP1 gene of the strains are shown with the VP1 gene sequences. A red square shows 2016 strains.

