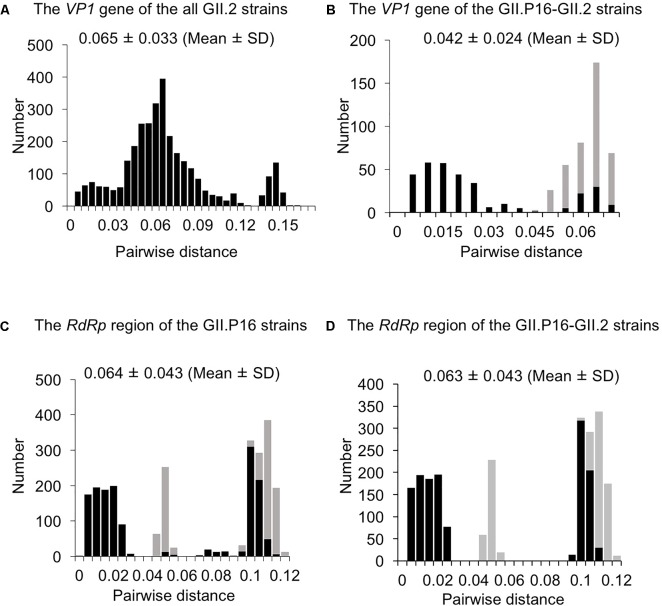
FIGURE 3.
Distribution of pairwise distances between HuNoV strains for (A) the VP1 gene of the all GII.2 strains, (B) the VP1 gene of the GII.P16-GII.2 strains, (C) the RdRp region of the GII.P16 strains, and (D) the RdRp region of the GII.P16-GII.2 strains, based on the nucleotide sequences. The pairwise distances between the 2016 strains and the other strains are shown by gray in (B–D).

