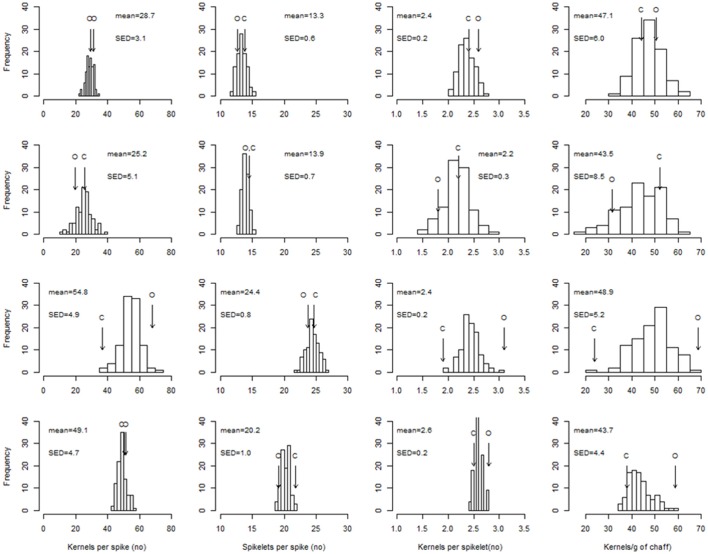
Figure 2.
Distribution of the RIL best linear unbiased predictors (BLUPs) for the number of kernels per spike, spikelets per spike, kernels per spikelet, and kernels per g chaff. Top row to bottom row: LD-V plants, LD-NV plants, SD-V plants, SD-FI plants. Arrows indicate the performance of the parents (O: cv. “Ofanto”; C: cv. “Senatore Cappelli”). SED: standard error of the difference between BLUPs.

