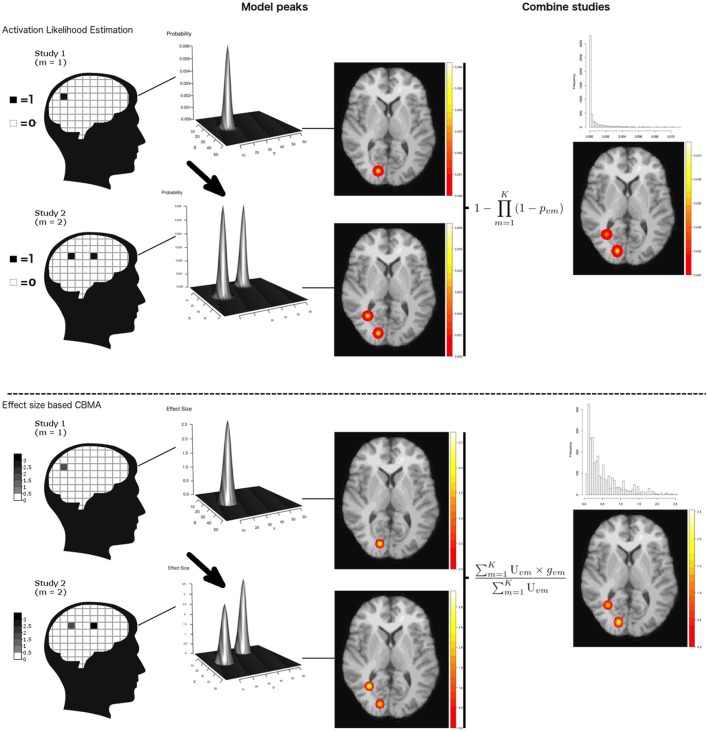
Figure 1.
Illustration of ALE and an effect size based CBMA. Reported coordinates are first modeled by applying a Gaussian kernel. These are then combined either through calculating probabilities or by transforming the test-statistics to effect sizes and calculate a weighted average. Note that for illustration purpose, we only plot the values > 0 in the histograms. Illustration is prior to thresholding.

