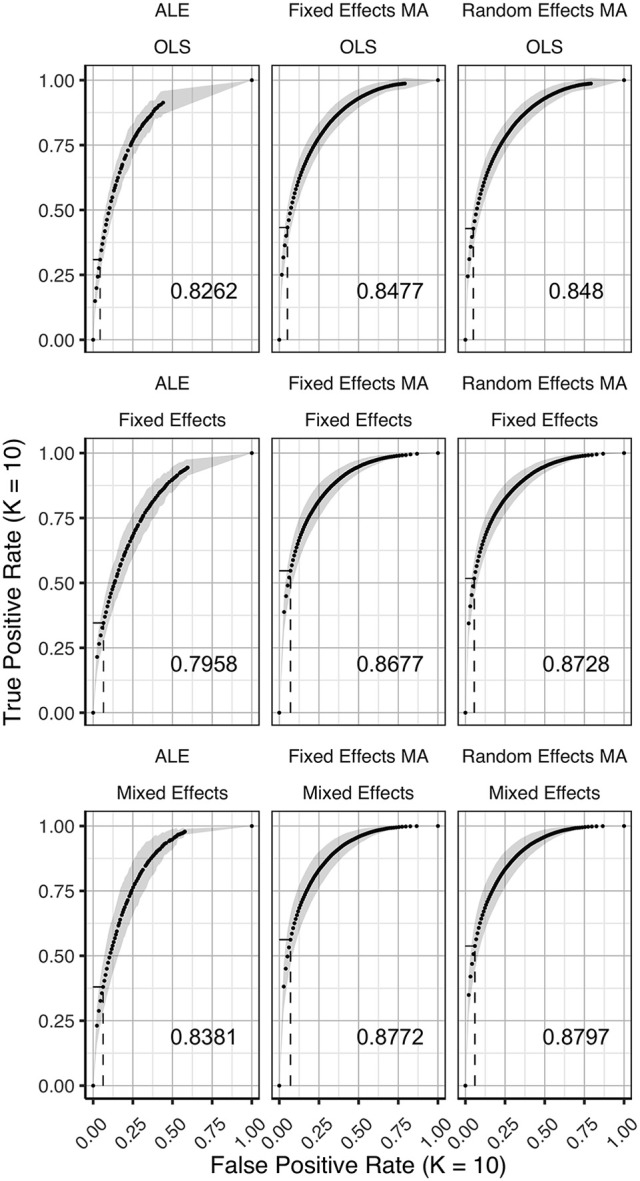
Figure 3.

ROC curves (±1 standard deviation), averaged over I = 7 folds plotting the observed true positive rate against the observed false positive rate for K = 10. The columns correspond to the coordinate-based meta-analyses (left, ALE uncorrected procedure; middle, fixed effects meta-analysis; right, random effects meta-analysis). The rows correspond to the second level GLM pooling models (top, OLS; middle, fixed effects; bottom, mixed effects). For each of those, the area under the curve (AUC) is calculated and shown within the plot. The drop-down lines correspond to the point at which the pre-specified nominal level is set at an uncorrected α level of 0.05.
