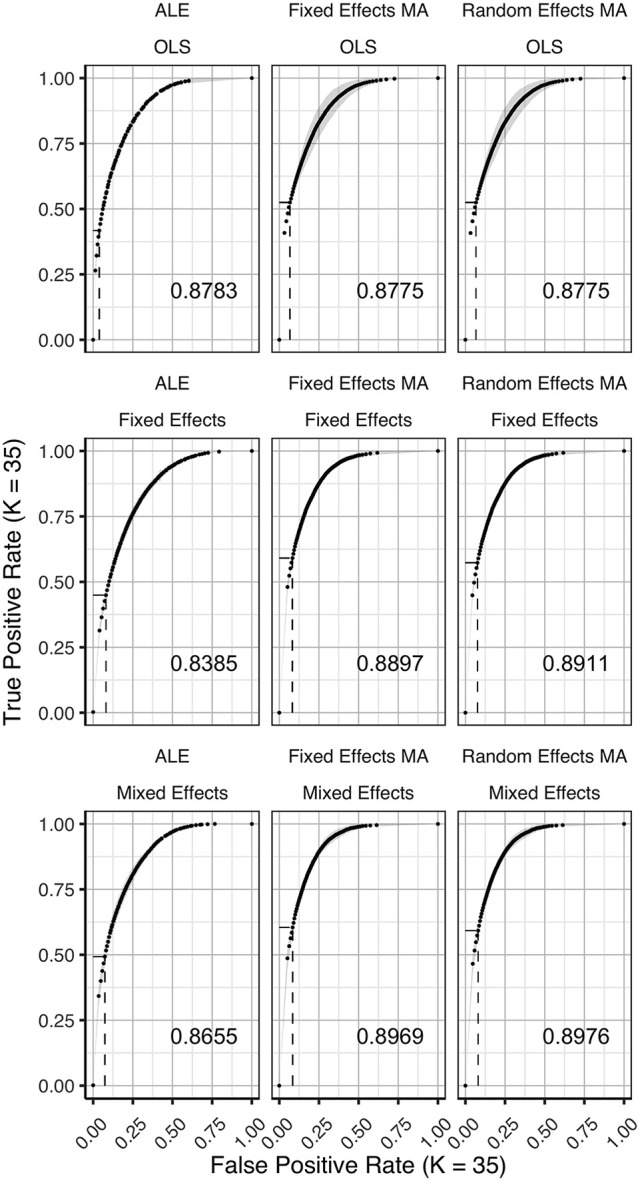
Figure 5.

ROC curves (±1 standard deviation), averaged over I = 2 folds plotting the observed true positive rate against the observed false positive rate for K = 35. The columns correspond to the coordinate-based meta-analyses (left, ALE uncorrected procedure; middle, fixed effects meta-analysis; right, random effects meta-analysis). The rows correspond to the second level GLM pooling models (top, OLS; middle, fixed effects; bottom, mixed effects). For each of those, the area under the curve (AUC) is calculated and shown within the plot. For each of those, the area under the curve (AUC) is calculated and shown within the plot. The drop-down lines correspond to the point at which the pre-specified nominal level is set at an uncorrected α level of 0.05.
