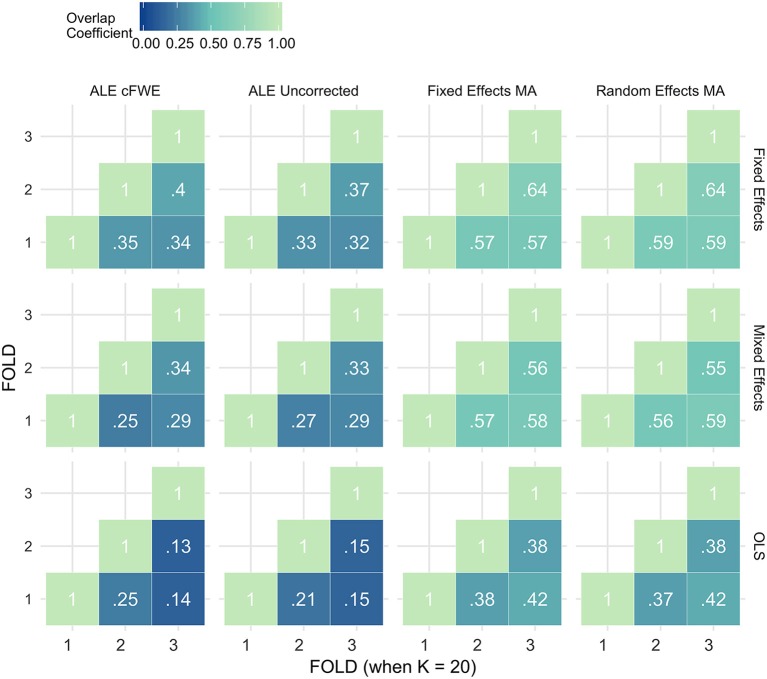
Figure 8.
Percent overlap of activation (ωa,b) from all pairwise comparisons for K = 20. The rows represent the group level models (top to bottom: fixed effects, mixed effects and OLS). The columns represent the thresholded meta-analyses. From left to right: ALE cFWE at 0.05, ALE uncorrected at 0.001 and fixed and random effects CBMA at 0.005 with Z > 1.

