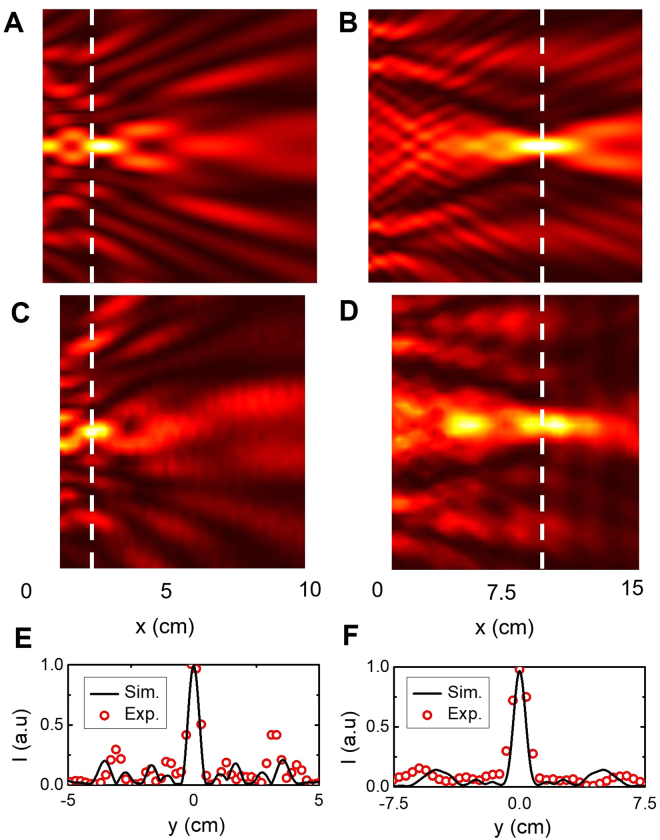
Figure 5.
Inverse-designed metalenses. Simulated (A,B) and measured (C,D) spatial power distributions along the x-y plane at the output of the metalenses at 38 GHz. The input plane wave is generated by a horn antenna 1 m away on the left of the device while the output is measured with a probe antenna scanned along a 9 × 10 cm x-y plane for the first lens (A,C) and a 14 × 15 cm plane for the second lens (B,D). The first lens focuses perpendicularly polarized EM field 2λ away from the device whereas the second lens focuses it 15λ away. Schematics and pictures of the 3D-printed lenses are shown next to the simulated and experimental maps respectively. (E) and (F) Cross-section of the simulated (black line) and measured (red circles) power along the white dashed lines on the color maps for the first (E) and second (F) lens.

