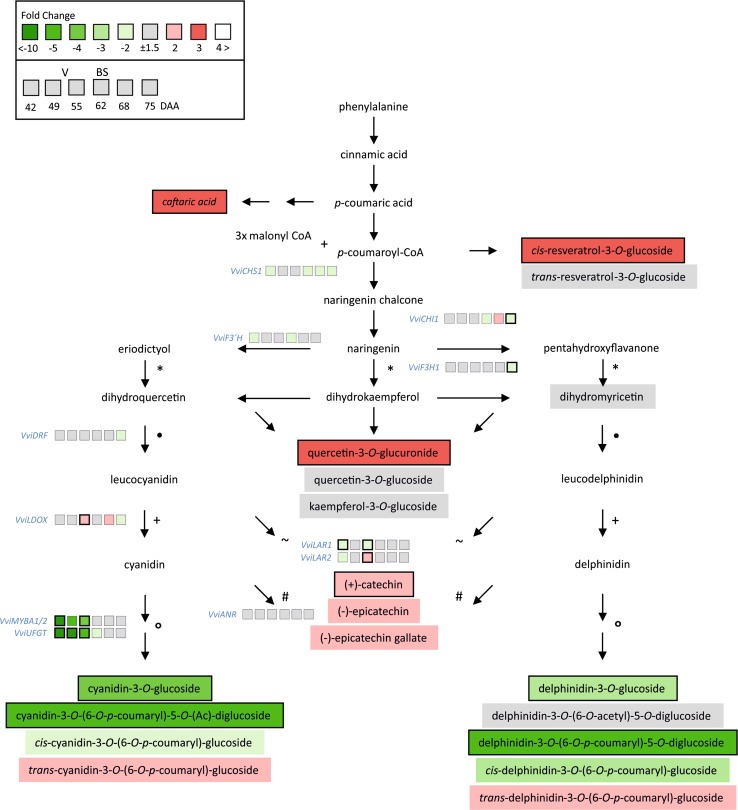
Fig. 1.
The simplified scheme of the phenylpropanoid and flavonoid pathways combines results obtained for polyphenols with LC–MS/MS and qPCR with selected genes along the biosynthesis pathway. Data are calculated as fold changes (BS in relation to H). Plant material collected on the 24.08.2011 (75 DAA) was used to determine polyphenols in grapevine berries (n = 4 each, P < 0.05). Compounds analyzed are named in square boxes. Timescale expression analyses with qPCR of selected genes (blue) were performed 42, 49, 55, 62, 68 and 75 DAA, and results are presented as six boxes near the gene name. The start of ripening (veraison, V) was at 55 DAA and the observation of first obvious symptoms (BS) was at 62 DAA. Green and red boxes indicate down- or up-regulation of the genes and abundance of metabolites, respectively. Bold frames identify significant differences (n = 4 each, P < 0.05) between healthy and BS samples. All data (compounds analyzed and expression as NRQ) are shown in Tables S2 and S3

