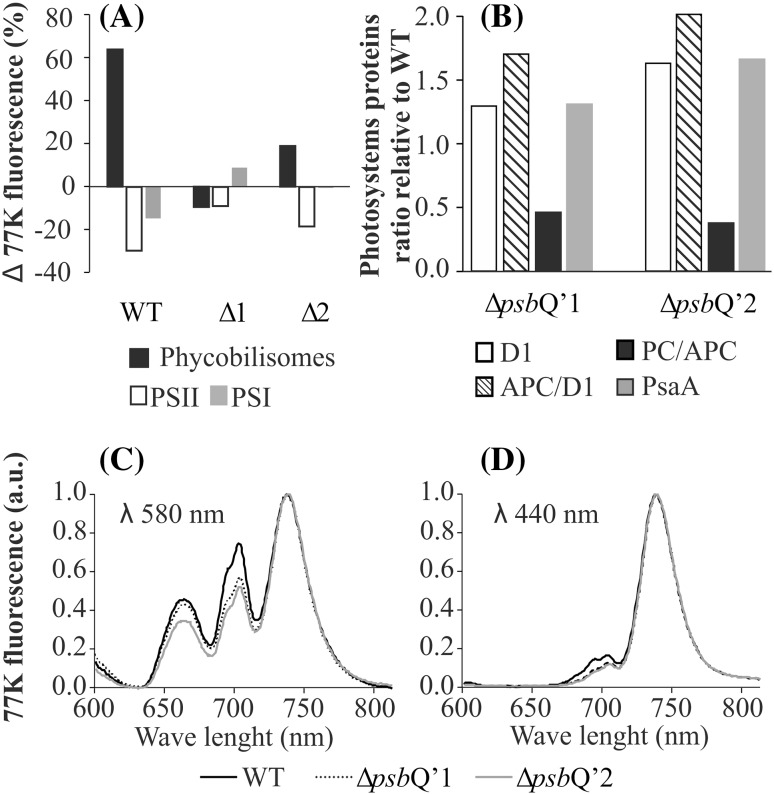
Fig. 4.
Cells fluorescence and antennae components. Mutant and the WT cells were exposed to 5 min pulse of 1000 µmoles photons m−2 s−1, than 77 K fluorescence spectra were recorded (before and after the pulse). Changes of relative fluorescence peak area were expressed as fraction of unexposed cells fluorescence (a). Western blot densitometric quantification of relative changes in protein abundance. Equal number of mutant and WT cells exhibits different proteins abundance, expressed as fraction of WT protein (b). 77 K fluorescence spectra were recorded for the phycobilisomes excitation wave λ = 580 (c), and chlorophyll a excitation wave λ = 440 (d)

