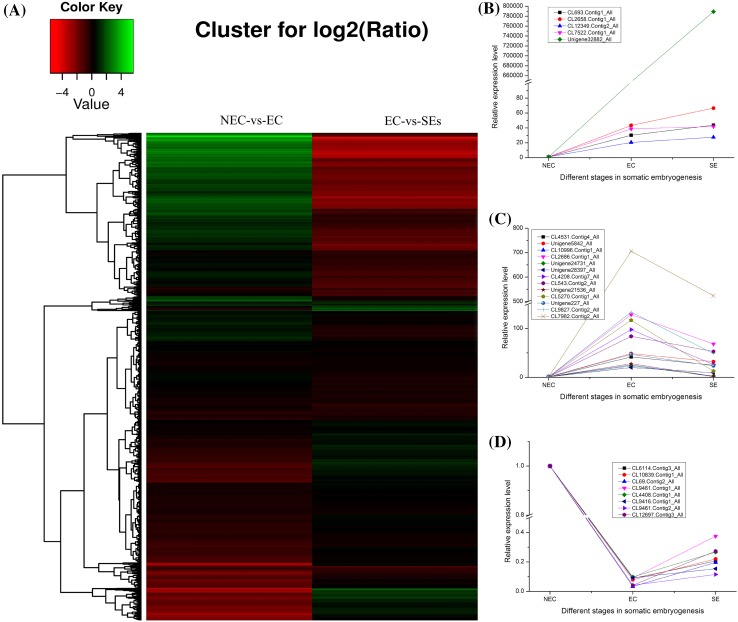
Fig. 5.
Cluster analysis of DAPs in NEC, EC and SEs. a Cluster analysis of DAPs in NEC, EC and SEs; b representative DAPs showing continuous accumulation from NEC to EC, and from EC to SEs, i.e. with a pattern of up- to up-regulation; c representative DAPs showing accumulation from NEC to EC, but decrease from EC to SEs, i.e. with a pattern of up- to down-regulation; d representative DAPs showing decrease from NEC to EC, but increase from EC to SEs, i.e. with a pattern of down- to up-regulation

