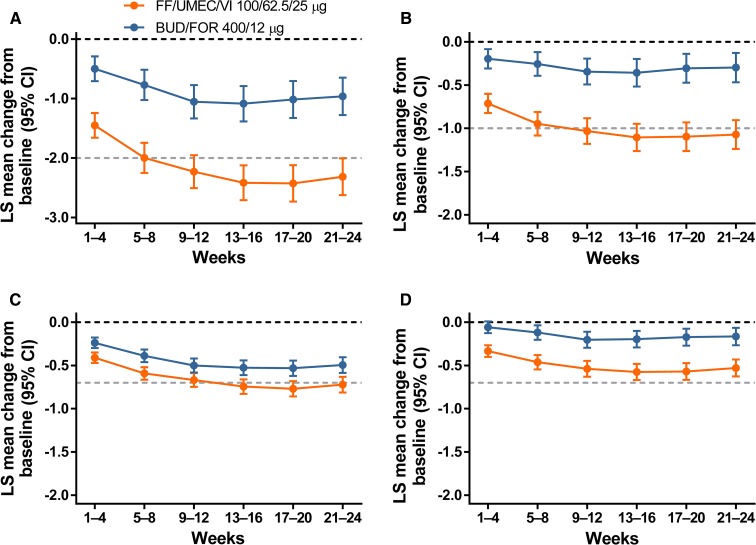
Fig. 2.
Mean change from baseline in 4-weekly E-RS: COPD scores (ITT): total score (a); breathlessness (b); cough and sputum (c); chest symptoms (d). Dark dotted lines represent baseline and light dotted lines represent response threshold. BUD/FOR budesonide/formoterol, CI confidence interval, E-RS: COPD Evaluating Respiratory Symptoms in COPD, FF/UMEC/VI fluticasone furoate/umeclidinium/vilanterol, ITT intent-to-treat, LS least squares

