Figure 3.

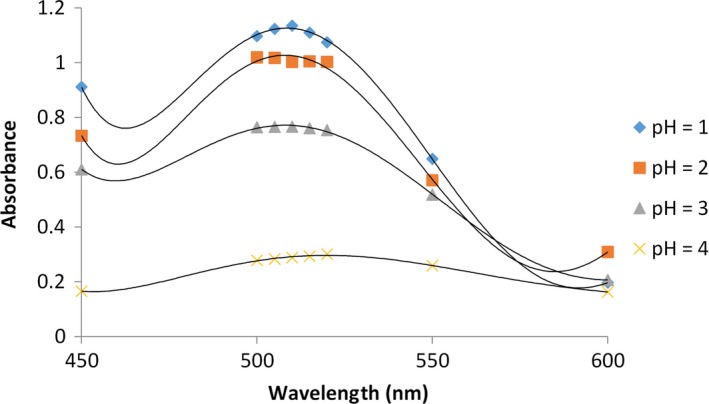
Diagram of the effects of different pH values on anthocyanin in blueberry; the data are the mean value for three replications ± standard deviation

Diagram of the effects of different pH values on anthocyanin in blueberry; the data are the mean value for three replications ± standard deviation