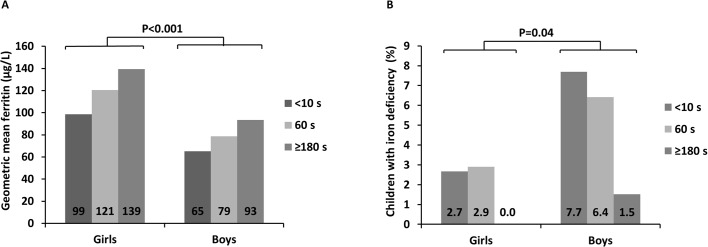
Figure 2.
Differences in infants’ iron status at the age of 4 months according to sex in three groups divided according to umbilical cord clamping time. (A) Geometric mean ferritin according to sex and time for umbilical cord clamping. (B) Proportion of children with iron deficiency according to time for umbilical cord clamping and sex.

