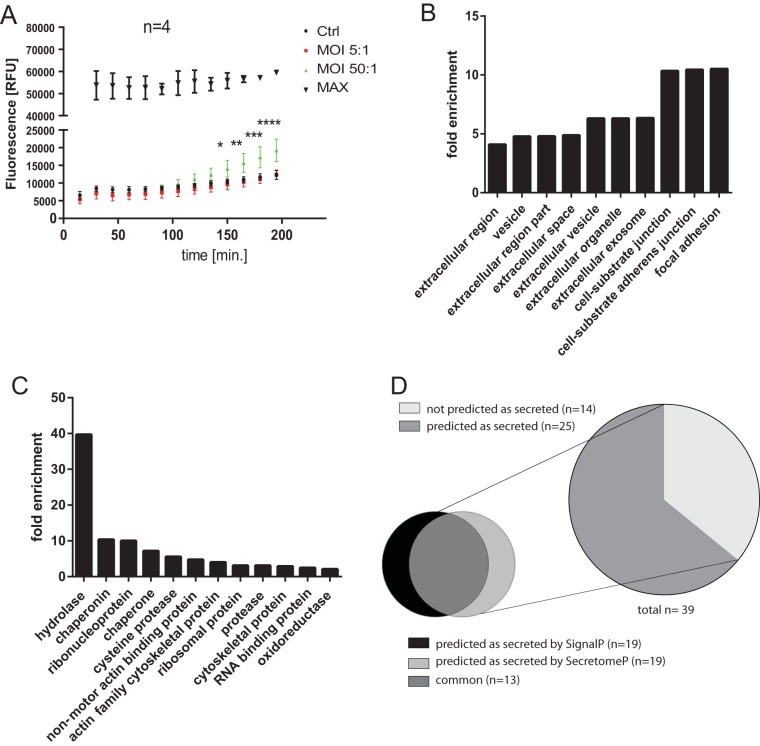
FIG 1.
(A) Cytotoxicity in macrophages infected with S. Typhimurium. THP-1 macrophages were infected with S. Typhimurium (MOI of 5:1 or 50:1) or left uninfected (n = 4). A CellTox Green cytotoxicity assay (Promega) was used, which enables measurement of changes in cytotoxicity at several time points (0 to 195 min postinfection). Alternatively, cells were lysed, to obtain 100% cytotoxicity measurement (MAX). Two-way ANOVA test was used for statistical analysis (GraphPad Prism). Means and standard deviations are shown for each sample. The P values are shown indicated for comparisons between control (uninfected) cells and cells infected with S. Typhimurium at an MOI of 50:1. For an MOI of 5:1, none of the results were significant. The P values are indicated by asterisks as follows: *, P ≤ 0.05; **, P ≤ 0.01; ***, P ≤ 0.001; and ****, P ≤ 0.0001. (B and C) GO terms of extracellular proteins identified by proteomics. All proteins obtained from cell culture medium of uninfected and S. Typhimurium-infected THP-1 macrophages were analyzed by label-free mass spectrometry, and their GO terms were analyzed by the PANTHER overrepresentation test. The GO molecular function and GO cellular component were both analyzed, Homo sapiens was used as a reference gene list for the fold enrichment analysis, and a Bonferroni correction for multiple testing was used in each case. The top GO terms were chosen in terms of the statistical significance (the smallest P value), and the fold enrichment for each term is shown. (D) Ab initio and signal peptide predictions of extracellular proteins with abundance significantly affected by S. Typhimurium infection. SignalP and SecretomeP were used to analyze the extracellular proteins with abundance affected by S. Typhimurium infection (Table 1).

