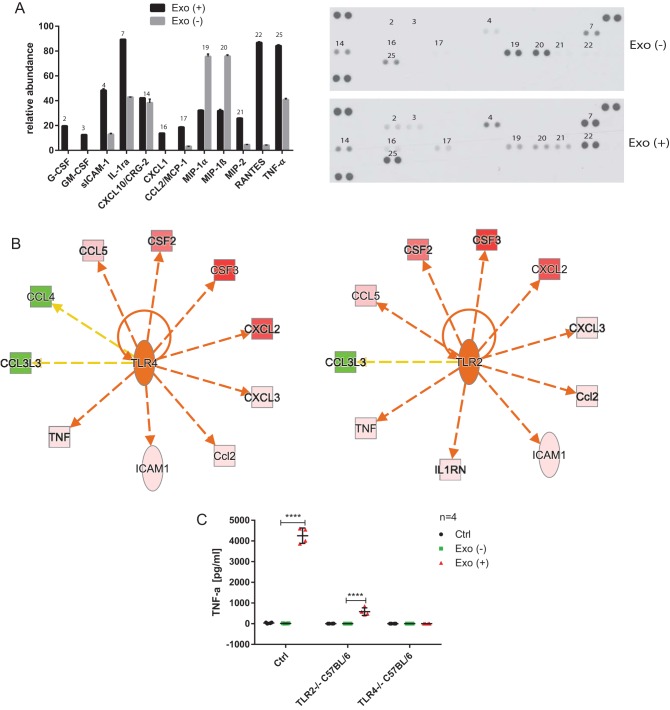
FIG 9.
Exosomes elicit TLR4-dependent stimulation of TNF-α in naive macrophages. (A) CD9+ exosomes (fraction F10) isolated from S. Typhimurium-infected [2 hpi; Exo (+)] or uninfected [Exo (−)] RAW 264.7 macrophages (see Fig. 7A and B) were used to treat naive RAW 264.7 macrophages. After 24 h, the cell culture supernatants were collected, and 40 cytokines were analyzed by a proteome profiler mouse cytokine array kit, panel A (R&D Systems). The experiment was performed in two biological and two technical replicates. The pixel intensity of spots was measured by ImageJ, and the relative abundance was adjusted to the background and visualized as a graph. The numbers above the bars (left) correspond to the numbers above the spots on the membrane (right) for technical duplicates of cytokines. (B) Relative abundance data from the cytokine panel were imported into Ingenuity Pathway Analysis software to identify activated/inhibited cellular receptors. TLR2, TLR4, and TLR5 had the highest probability of being activated by the exosomes derived from infected macrophages (data for TLR2 and TLR4 are shown). Downregulation of MIP-1α (CCL3L3) and MIP-1β (CCL4) in cells treated with exosomes derived from infected versus uninfected cells was inconsistent with the IPA analysis. Abbreviations: TNF, TNF-α; ICAM1, sICAM-1; Ccl2, MCP-1; CXCL3, MIP-2; CXCL2, MIP-1; CSF3, G-CSF; CSF2, GM-CSF; CCL5, RANTES; CCL4, MIP-1β; CCL3L3, MIP-1α; IL-1RN, IL1RA. Red and green molecules indicate increased and decreased abundances, respectively. The orange arrows and central molecules (TLR2 and TLR4) indicate activation, while the yellow arrows indicate findings inconsistent with the predicted activation of central molecules. (C) Control murine macrophages and TLR2−/− and TLR4−/− C57BL/6 macrophages were treated with exosomes derived from uninfected or infected (MOI of 5:1, 2 hpi) RAW 264.7 macrophages or with PBS (control). After 24 h of treatment, the concentration of TNF-α in CCS was measured by ELISA. The results of four biological replicates are shown. One-way ANOVA test with Tukey's multiple testing correction was used to establish statistical significance. P values are indicated as follows: *, P ≤ 0.05; **, P ≤ 0.01; ***, P ≤ 0.001; and ****, P ≤ 0.0001.

