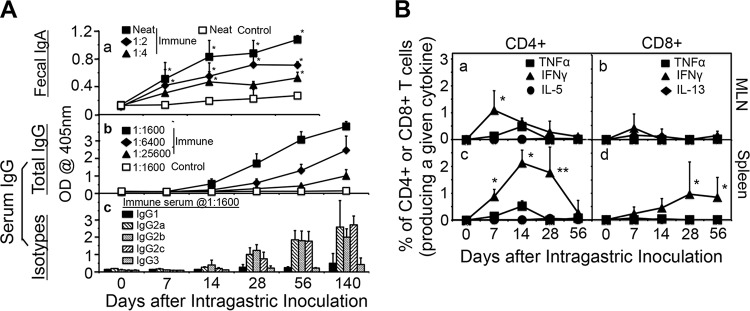
FIG 4.
Induction of humoral and cellular immune responses by intragastric immunization with C. muridarum. (A) C57BL/6J mice with intragastric immunization with CM-mCherry (solid symbols, n = 5) and naive mice (open symbols, n = 5) were monitored for fecal IgA (a) and serum IgG (b) as well as serum IgG isotypes (c) on different days after immunization (days 0 to 56 for IgA and days 0 to 140 for serum IgG). Samples collected from mice prior to immunization were defined as day 0 samples. CM-mCherry EB were used as antigens and were used to coat the ELISA plates. For the measurement of IgA, undiluted fecal suspensions (neat) from the immunized mice or fecal suspensions from the immunized mice diluted 1:2 or 1:4 along with neat samples from the control mice were tested. Serum samples from the same mice were 4-fold serially diluted, and to assess serum anti-C. muridarum IgG responses, 1:1,600, 1:6,400, and 1:25,600 dilutions were included for immunized mice and 1:1,600 dilutions were included for control mice. Immunization via the GI tract induced significantly higher levels of anti-C. muridarum IgA in the gut and IgG antibodies in the serum (*, P < 0.05, Wilcoxon rank-sum test) compared with the levels of the other antibodies. (c) For the isotyping of serum IgG, the binding of serum samples from immunized mice (at a 1:1,600 dilution) to the plate-immobilized EBs was probed by the use of HRP-conjugated goat anti-mouse IgG1, IgG2a, IgG2b, IgG2c, and IgG3. The ELISA results were expressed as raw OD values, as displayed on the y axis. Immunization via the GI tract induced significantly higher levels of anti-C. muridarum IgG2 antibodies than IgG1 and IgG3 antibodies. (B) C57BL/6J mice intragastrically immunized with 2 × 10⁵ IFU of CM-mCherry or control mice were sacrificed on days 0 (n = 2), 7 (n = 5 for immunized mice, n = 2 for control mice), 14 (n = 4 for immunized mice, n = 2 for control mice), 28 (n = 8 for immunized mice, n = 2 for control mice), or 56 (n = 10 for immunized mice, n = 2 for control mice) to detect the intracellular cytokines TNF-α, IFN-γ, IL-5, and IL-13 in CD4+ (left) and CD8+ (right) T cells from mesenteric draining lymph nodes (MLN) (top) and spleen (bottom). Results are expressed as the percentage of CD4+ or CD8+ T cells that express a given cytokine. Immunized mice developed dominant IFN-γ-producing CD4+ and CD8+ T cell responses in both the MLN and spleen. P values are for the number of IFN-γ-producing T cells versus the number of T cells that produced TNF-α, IL-5, or IL-13. *, P < 0.05, Wilcoxon rank-sum test; **, P < 0.01, Wilcoxon rank-sum test.

